Fig. 6.
Download original image
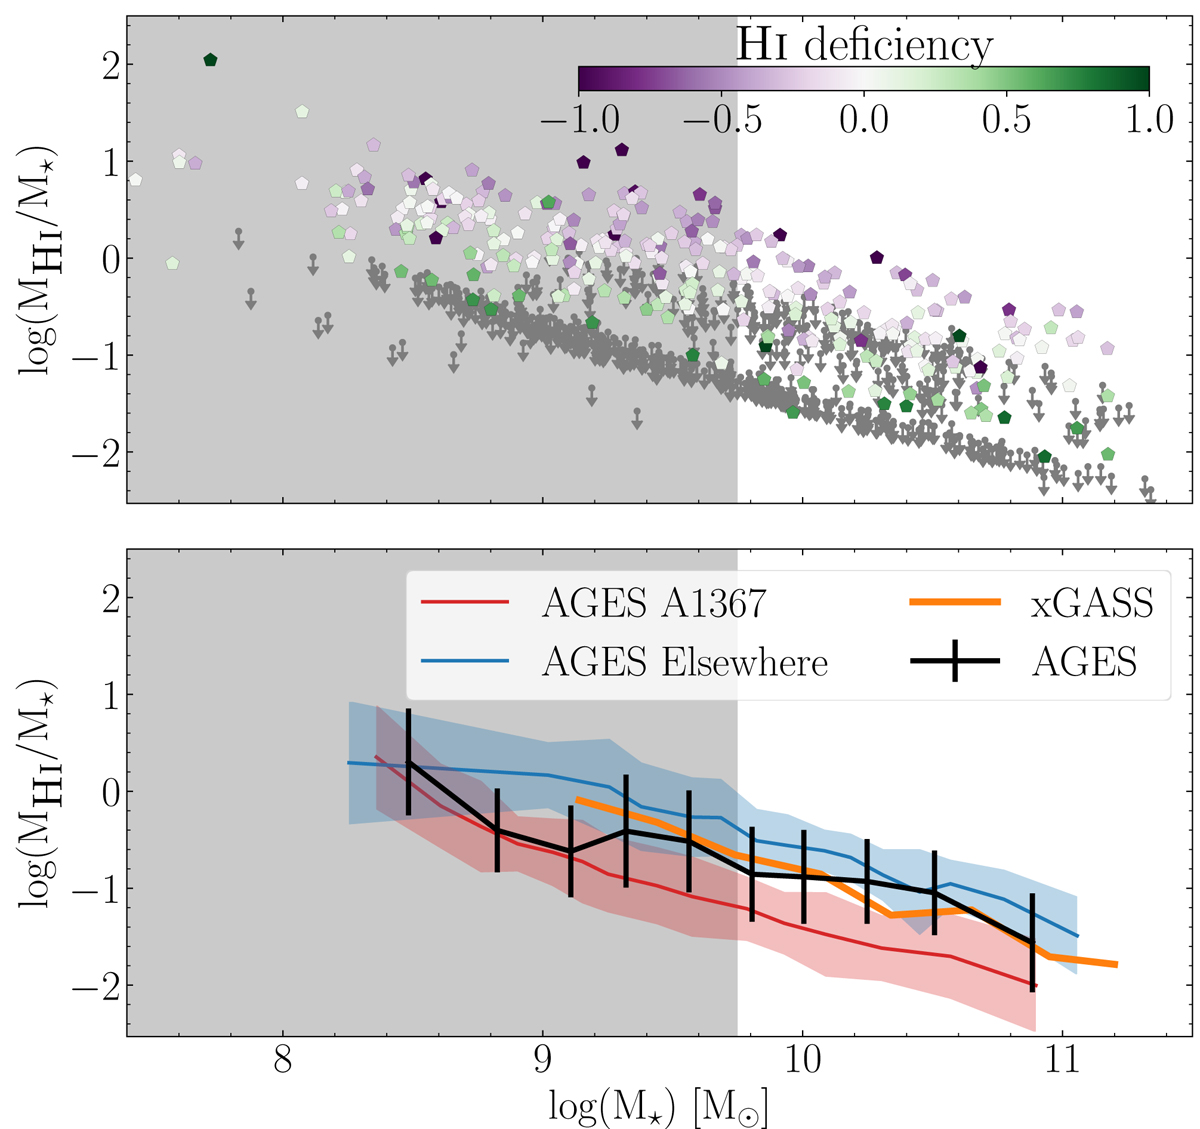
Ratio of total mass in atomic hydrogen to total stellar mass for all AGES detections with known optical counterparts (pentagons) and upper limits for non-detections (grey, down-pointing arrows). The pentagons are colour coded according to their H I deficiency. The thick black line shows the median of all AGES galaxies. The orange solid line shows the median values for xGASS galaxies (Catinella et al. 2018). The grey shaded region encompasses the data excluded from the stellar-mass-limited sample. The red and blue curves and shaded regions show the median relations for AGES galaxies that are members of the A1367 cluster and non-members, respectively. ![]() [Link]
[Link]
Current usage metrics show cumulative count of Article Views (full-text article views including HTML views, PDF and ePub downloads, according to the available data) and Abstracts Views on Vision4Press platform.
Data correspond to usage on the plateform after 2015. The current usage metrics is available 48-96 hours after online publication and is updated daily on week days.
Initial download of the metrics may take a while.