Fig. 5.
Download original image
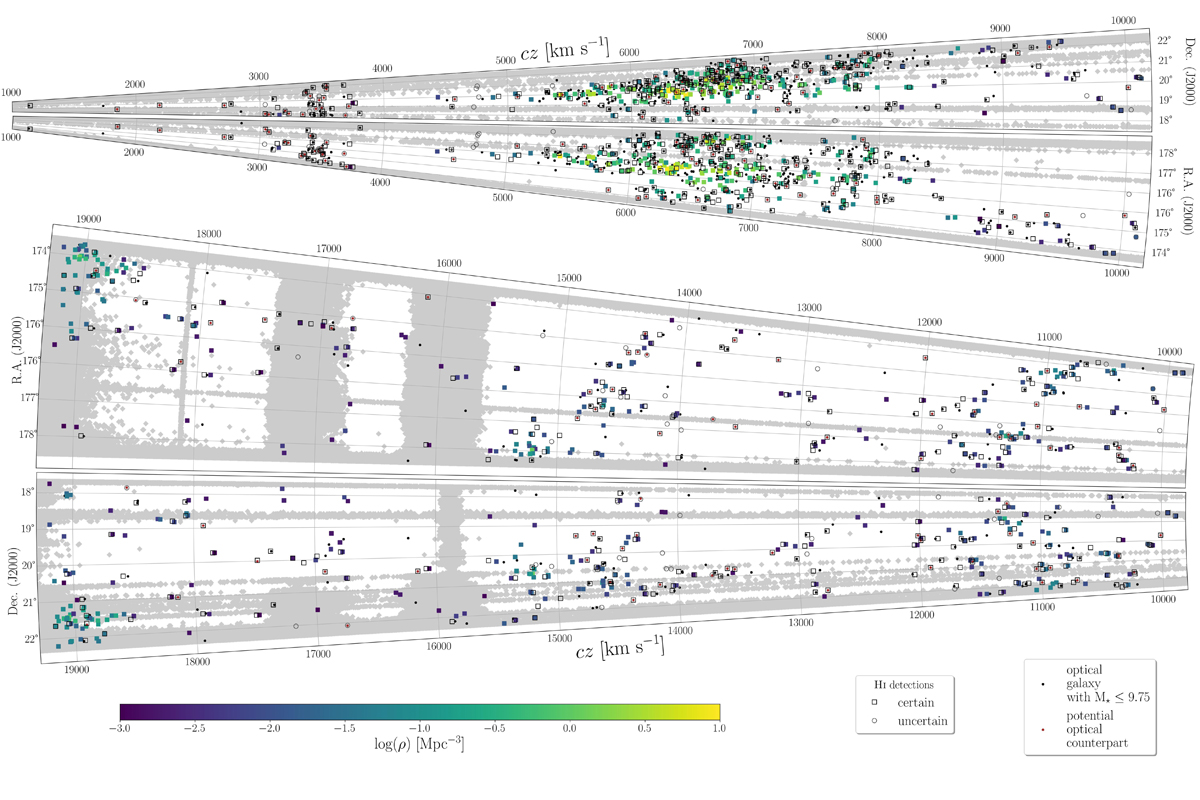
Polar plot showing the distribution of the H I-detected and optical galaxies in the RA – cz and Dec – cz planes. The z range of the survey is split in two for clarity. Large squares of different colour show galaxies with spectroscopic redshift from SDSS and with stellar mass M⋆ ≥ 9.75 M⊙ with the colour indicating their local density according to the colour bar. Small black points show optical galaxies with stellar mass below this limit. Small brown points mark potential optical counterparts without optical redshift. Certain H I detections are shown with empty, black squares, uncertain ones with empty, dark-grey circles. The light-grey shaded areas of the map show areas where the ability to detect H I signal is reduced (see text for details). The figure is meant to be viewed on a (large) screen. ![]() [Link]
[Link]
Current usage metrics show cumulative count of Article Views (full-text article views including HTML views, PDF and ePub downloads, according to the available data) and Abstracts Views on Vision4Press platform.
Data correspond to usage on the plateform after 2015. The current usage metrics is available 48-96 hours after online publication and is updated daily on week days.
Initial download of the metrics may take a while.