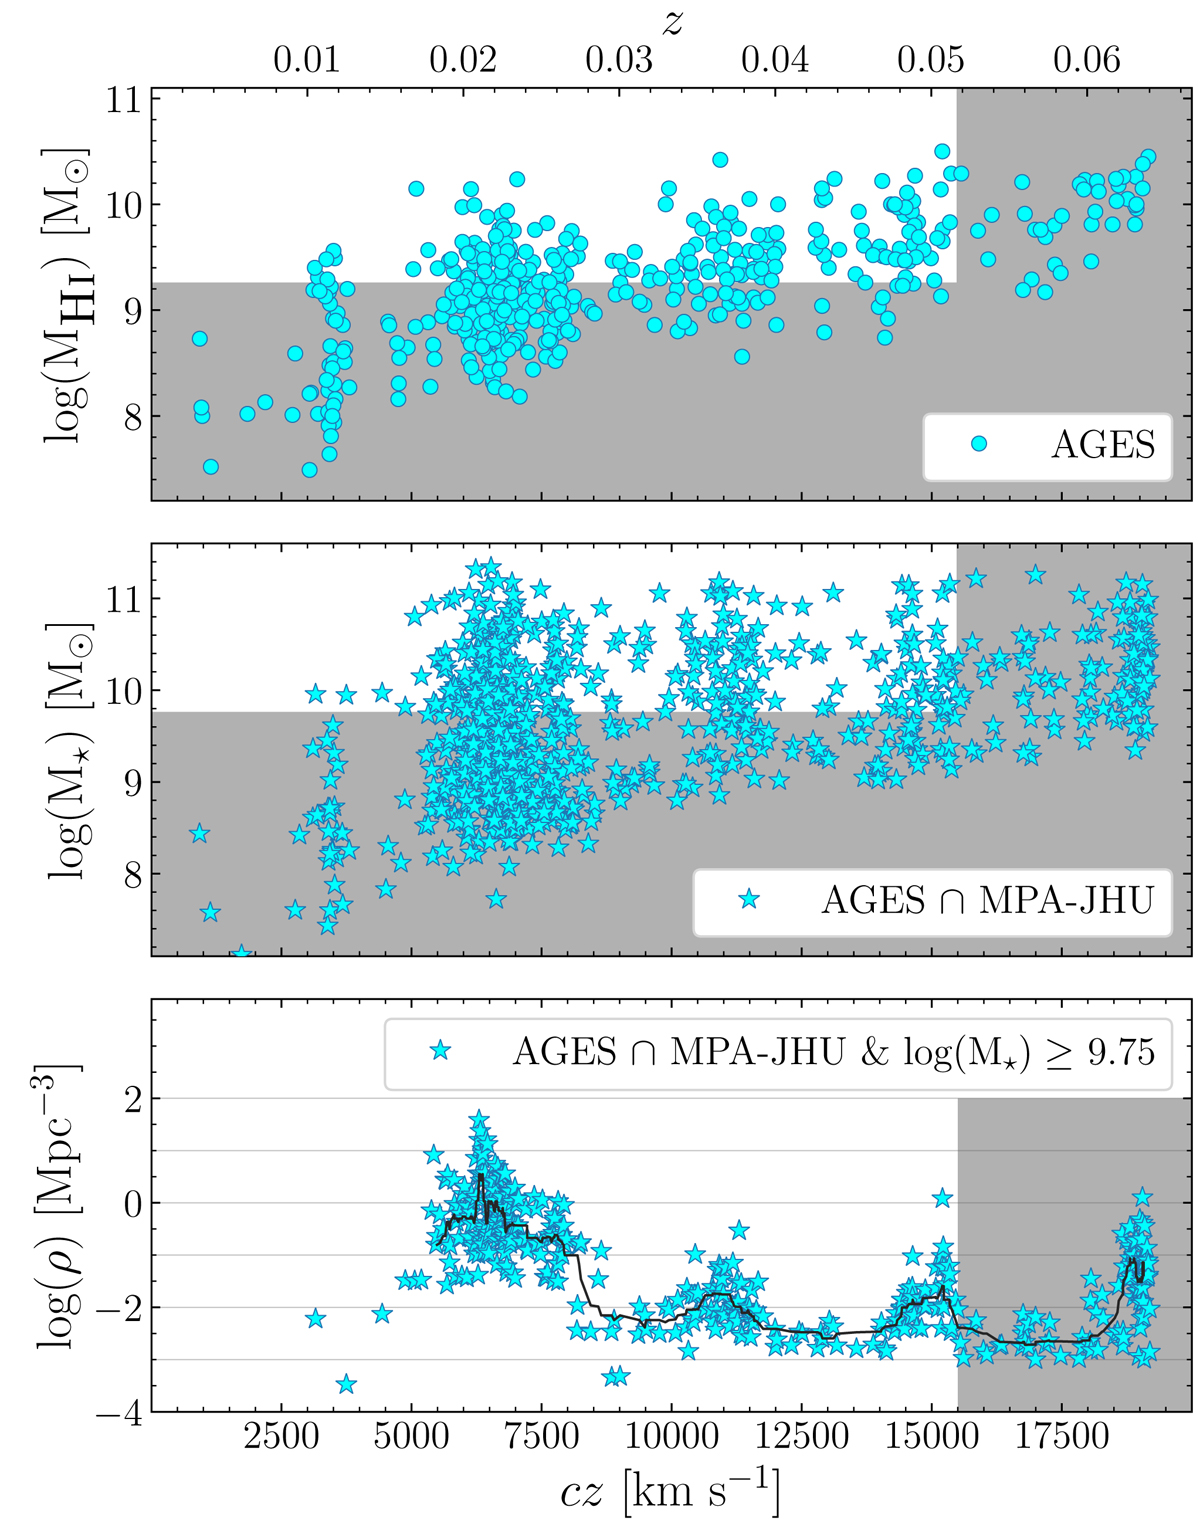
Fig. 4.
Download original image
Distribution of H I mass for all AGES detections (top) and stellar mass for all optical galaxies in the intersection between AGES and MPA-JHU (middle) as a function of recession velocity. The shaded regions indicate the areas not complete in MH I and M⋆, respectively. Bottom panel: local galaxy density for the mass-complete part of the middle sample. The black line shows the running median. ![]() [Link]
[Link]
Current usage metrics show cumulative count of Article Views (full-text article views including HTML views, PDF and ePub downloads, according to the available data) and Abstracts Views on Vision4Press platform.
Data correspond to usage on the plateform after 2015. The current usage metrics is available 48-96 hours after online publication and is updated daily on week days.
Initial download of the metrics may take a while.