Open Access
Fig. 3.
Download original image
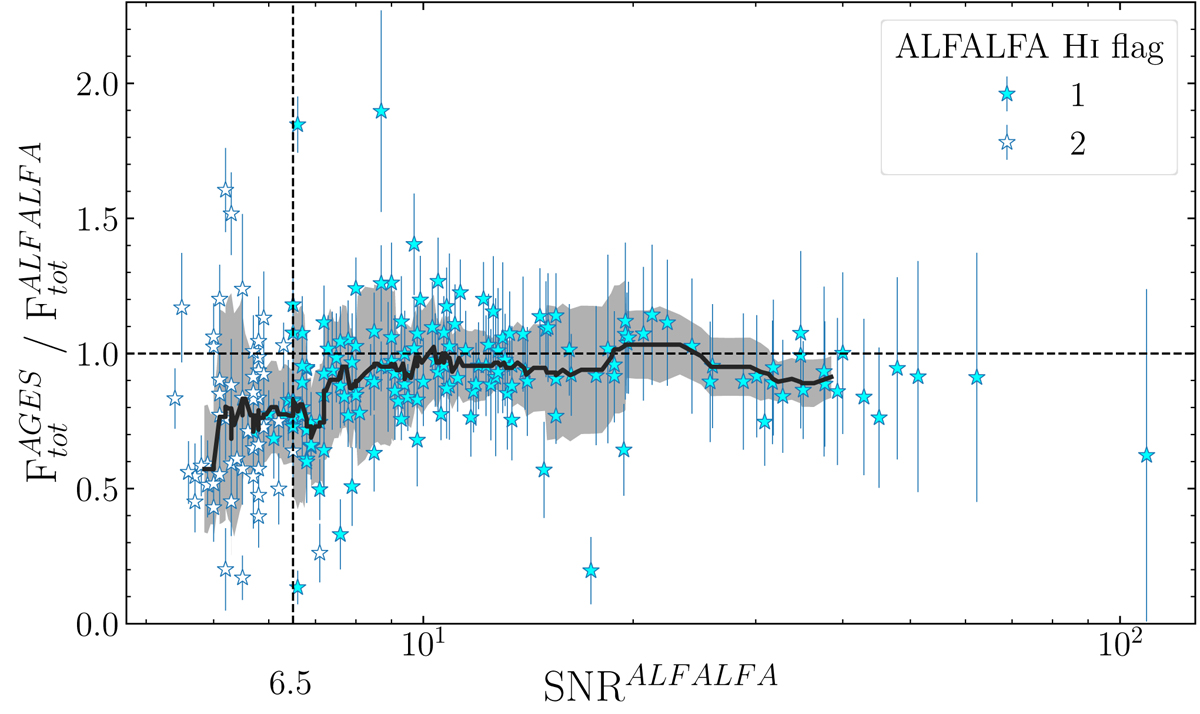
Comparison between the measured total line flux of H I sources common to both ALFALFA and AGES surveys. The flux ratio is plotted as a function of the ALFALFA S/N. The black curve and shaded region represent a running median and ±1σ. The detection reliability limit is indicated with the vertical dashed line. ![]() [Link]
[Link]
Current usage metrics show cumulative count of Article Views (full-text article views including HTML views, PDF and ePub downloads, according to the available data) and Abstracts Views on Vision4Press platform.
Data correspond to usage on the plateform after 2015. The current usage metrics is available 48-96 hours after online publication and is updated daily on week days.
Initial download of the metrics may take a while.