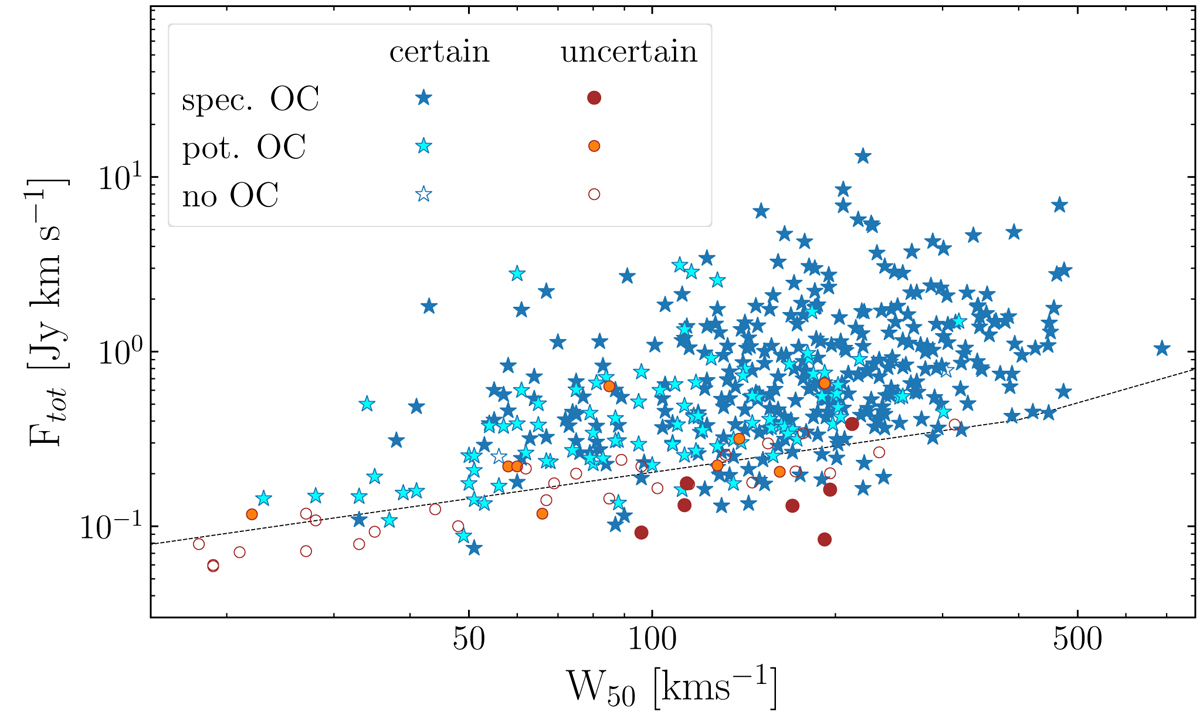
Fig. 2.
Download original image
Distribution of total flux in the 21 cm line as a function of line width for the certain detections (stars) and uncertain ones (circles). Filled and empty symbols show detections with and without an optical counterpart (OC), respectively, with the different shade fill segregating the spectroscopically confirmed and the potential optical counterparts. The dashed black line shows the ALFALFA reliability limit (Saintonge 2007) at 6.5σ. ![]() [Link]
[Link]
Current usage metrics show cumulative count of Article Views (full-text article views including HTML views, PDF and ePub downloads, according to the available data) and Abstracts Views on Vision4Press platform.
Data correspond to usage on the plateform after 2015. The current usage metrics is available 48-96 hours after online publication and is updated daily on week days.
Initial download of the metrics may take a while.