Fig. 1.
Download original image
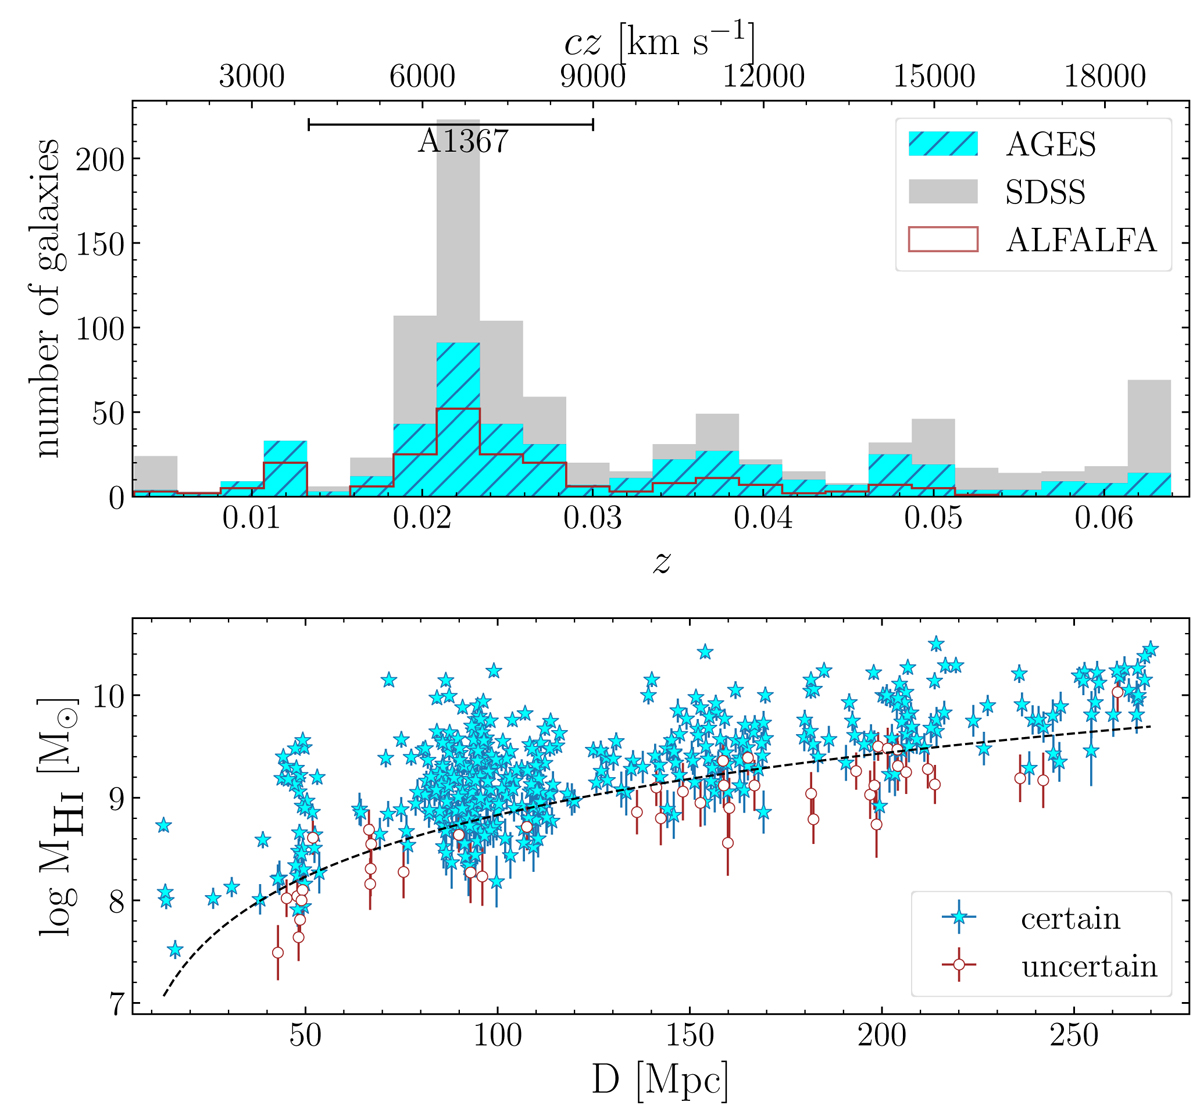
Top: redshift distribution of the AGES H I detections (cyan hatched histogram) compared to SDSS spectroscopic galaxies (solid grey histogram), and ALFALFA detections (empty brown histogram) within the AGES volume. The velocity range of A1367 is indicated with the horizontal bar. Bottom: distribution of MH I as a function of distance to the source, assuming Hubble flow distances. The black, dashed line shows the mass of a galaxy with velocity width of 200 km s−1 detected at 6.5σ. Certain and uncertain detections are shown with blue stars and brown circles, respectively. ![]() [Link]
[Link]
Current usage metrics show cumulative count of Article Views (full-text article views including HTML views, PDF and ePub downloads, according to the available data) and Abstracts Views on Vision4Press platform.
Data correspond to usage on the plateform after 2015. The current usage metrics is available 48-96 hours after online publication and is updated daily on week days.
Initial download of the metrics may take a while.