Fig. 9
Download original image
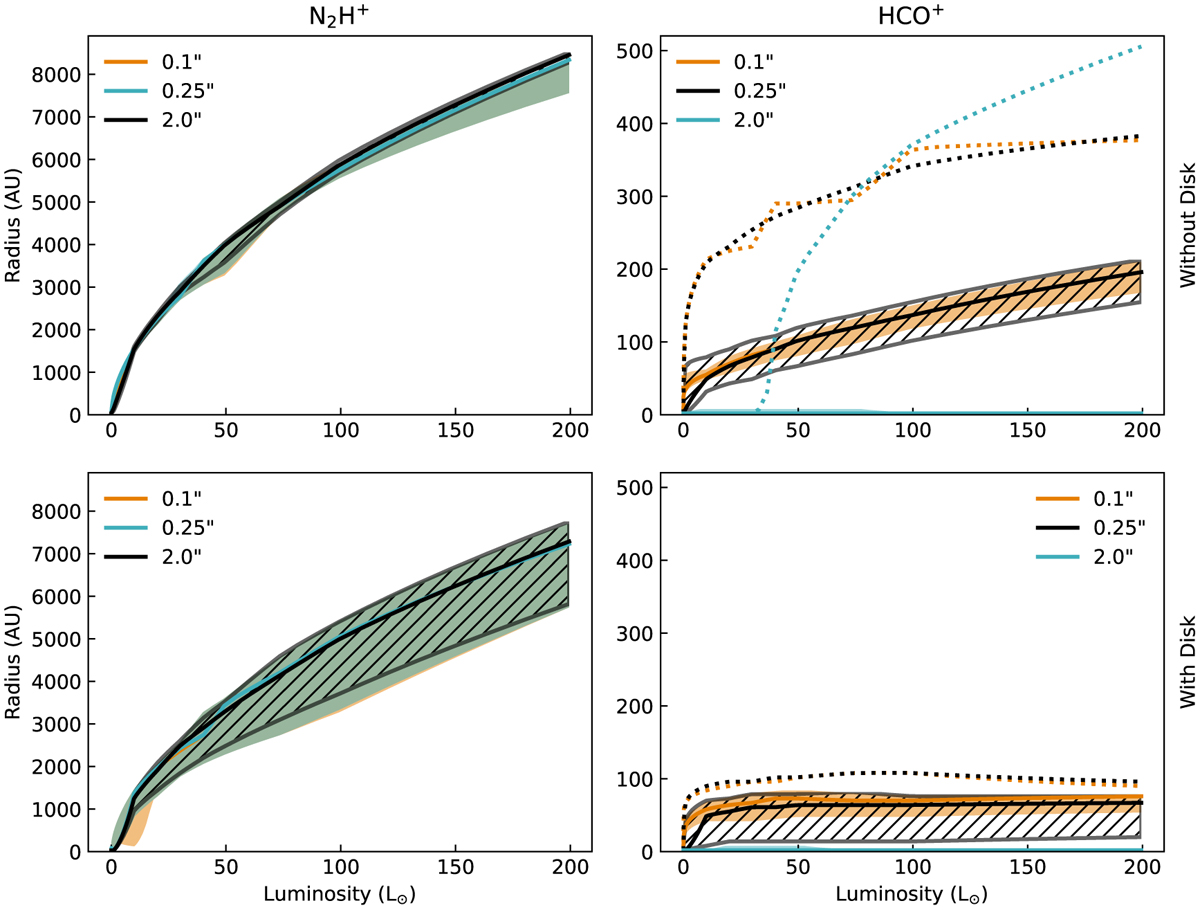
Peak radius of N2H+ (left column), and HCO+ (right column) simulated emission versus central protostellar luminosity for the fiducial models (black hatch) without disk (top row), and with disk (bottom row). The different shaded areas show how the measured peak radius is altered by the spatial resolution used for observations. The solid curve shows the relation for i = 45°. For N2H+, the shaded area indicates the range of peak radii for inclinations between 0° (face-on) and 90° (edge-on). For HCO+, the shaded area indicates the range of peak radii for inclinations between 15° and 90°, while the dotted line shows the peak radius versus luminosity for i = 0° (edge-on).
Current usage metrics show cumulative count of Article Views (full-text article views including HTML views, PDF and ePub downloads, according to the available data) and Abstracts Views on Vision4Press platform.
Data correspond to usage on the plateform after 2015. The current usage metrics is available 48-96 hours after online publication and is updated daily on week days.
Initial download of the metrics may take a while.