Fig. 7
Download original image
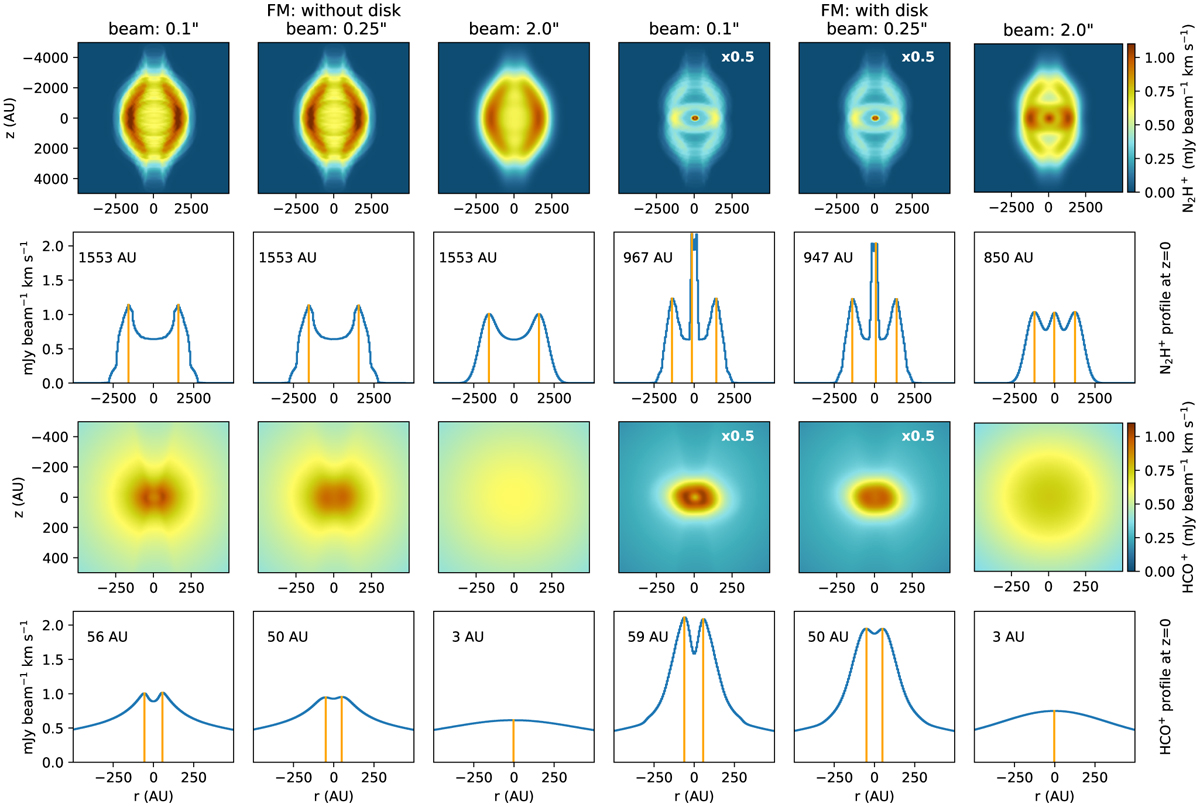
Simulated line emission maps showing the effect of spatial resolution (0.1″, 0.25″, and 2″) on the measured emission peak positions of N2H+ and HCO+. All models have an inclination of 45°. The first three columns show the fiducial model without disk. The other three columns show the fiducial model with disk. The second and third rows show corresponding slices extracted along the z = 0, with the number on the top left corner indicating the distance in AU of the peak from the center (i.e., peak radius). These positions are shown with orange vertical lines.
Current usage metrics show cumulative count of Article Views (full-text article views including HTML views, PDF and ePub downloads, according to the available data) and Abstracts Views on Vision4Press platform.
Data correspond to usage on the plateform after 2015. The current usage metrics is available 48-96 hours after online publication and is updated daily on week days.
Initial download of the metrics may take a while.