Fig. 6
Download original image
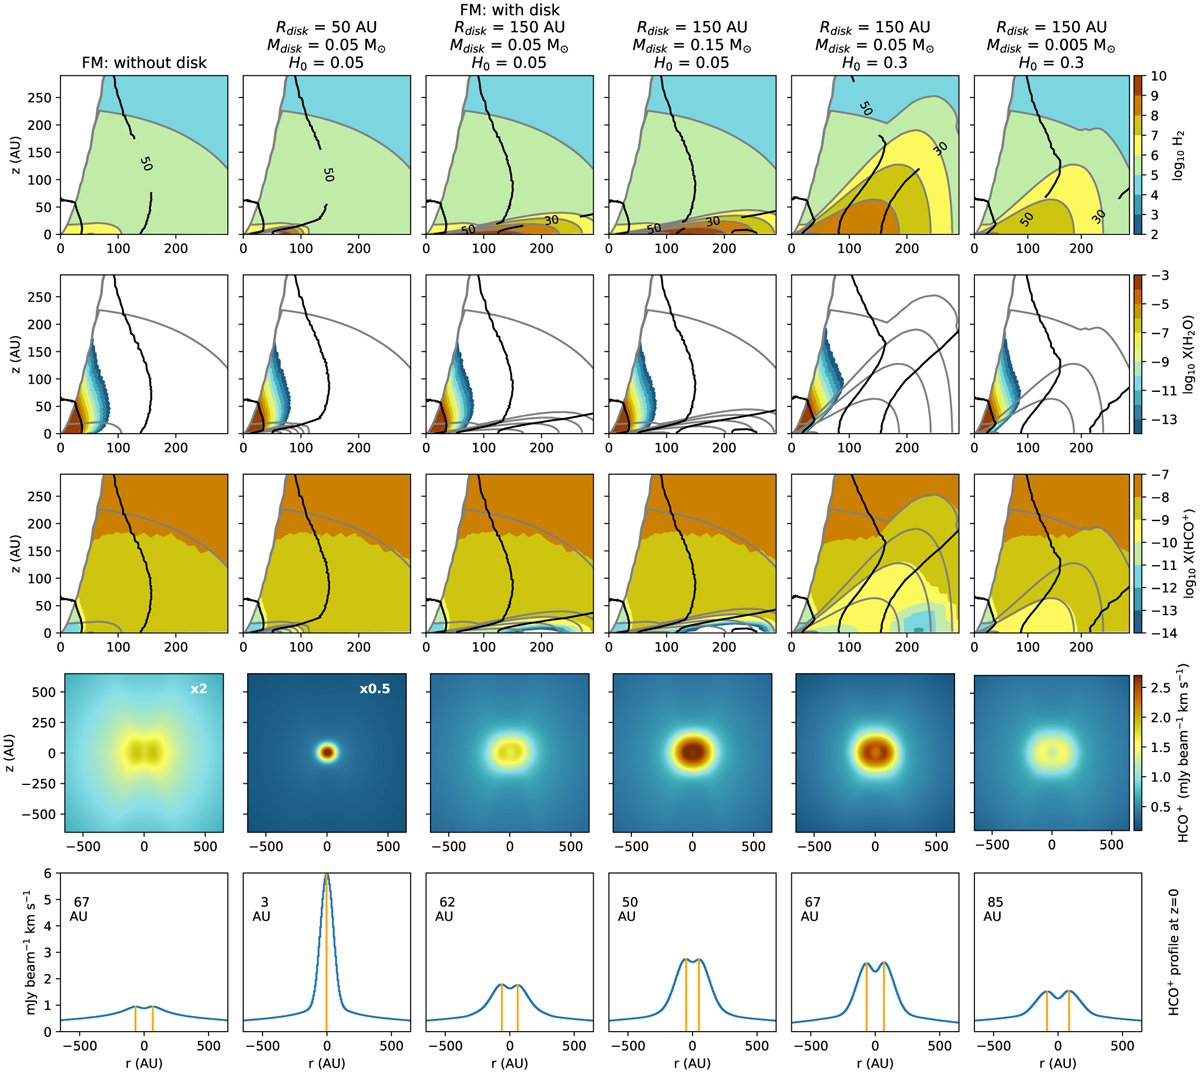
Effect of disk geometry parameters on the H2O snowline location. Molecular distributions are shown in the top three rows. The fourth row shows the simulated intensity integrated line emission maps for HCO+ 3−2. Images that have been scaled for better comparison have the scaling factor on the top right corner. The fifth row shows the corresponding slice extracted along z = 0 from the HCO+ simulated emission maps. The average distance of the peaks from the center (i.e., peak radius) is indicated in AU in the top left corner. These positions are shown with orange vertical lines. No scaling has been applied to the HCO+ profiles. The first and third columns show the fiducial models without and with disk, respectively. The additional columns show the effect of changing disk radius Rdisk (second column), disk mass (fourth column), scale height H0 (fifth column), and disk density (sixth column). Fractional abundances of all molecular species are relative to total number density of H2 (top row). The black and gray contours show gas temperature and density, respectively. The simulated line emission maps are shown at i = 45° and convolved to a beam of 0.25″.
Current usage metrics show cumulative count of Article Views (full-text article views including HTML views, PDF and ePub downloads, according to the available data) and Abstracts Views on Vision4Press platform.
Data correspond to usage on the plateform after 2015. The current usage metrics is available 48-96 hours after online publication and is updated daily on week days.
Initial download of the metrics may take a while.