Fig. 3
Download original image
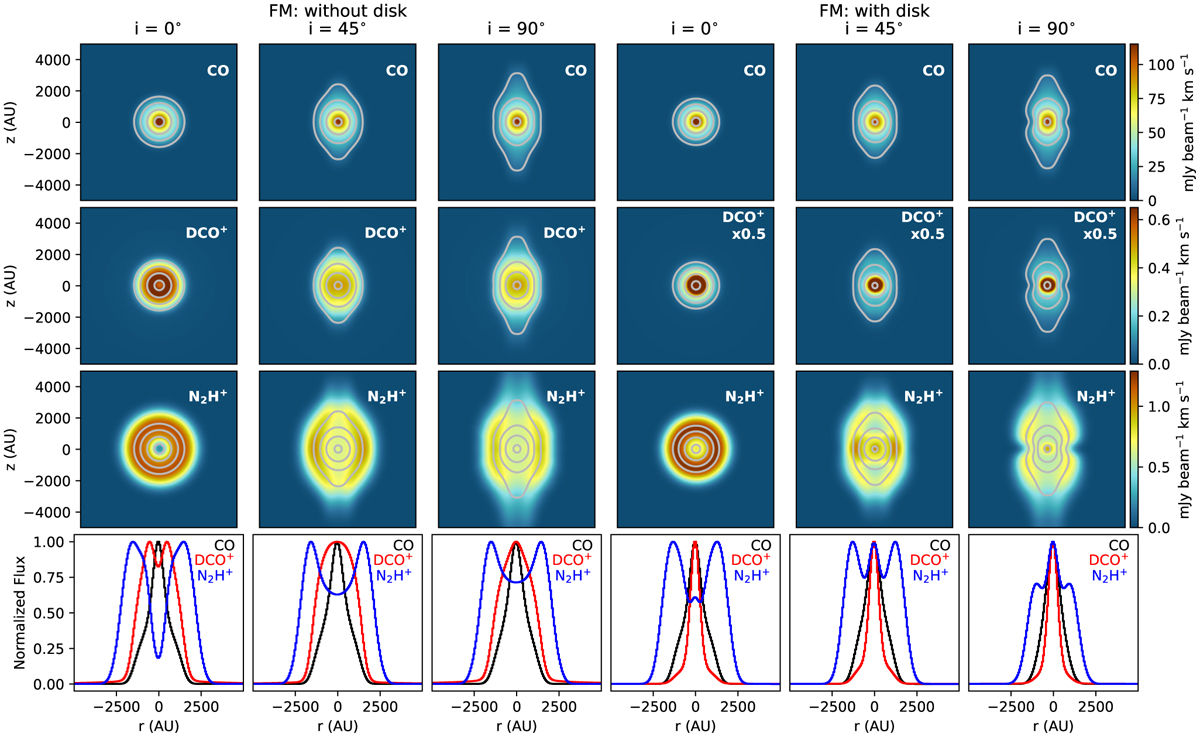
Robustness of N2H+ and DCO+ as CO snowline location tracers. Integrated intensity maps of the simulated line emission show CO (top row), DCO+ (second row) and N2H+ (third row) emission. Contours in all three rows are for CO at 10, 30, 50, and 100 mJy beam−1 km s−1. Images that have been scaled for better comparison have the scaling factor noted on the top right corner. Different inclinations are shown in order to determine if inclination affects the robustness of N2H+ and DCO+ as snowline position tracers. Inclinations shown are from face-on (i = 0°) to edge-on (i = 90°). The first three columns show the fiducial model without disk, while the other three columns show the fiducial model with disk. Slices extracted along z = 0 from the simulated line emission maps are shown in the bottom row normalized to the peak of each profile.
Current usage metrics show cumulative count of Article Views (full-text article views including HTML views, PDF and ePub downloads, according to the available data) and Abstracts Views on Vision4Press platform.
Data correspond to usage on the plateform after 2015. The current usage metrics is available 48-96 hours after online publication and is updated daily on week days.
Initial download of the metrics may take a while.