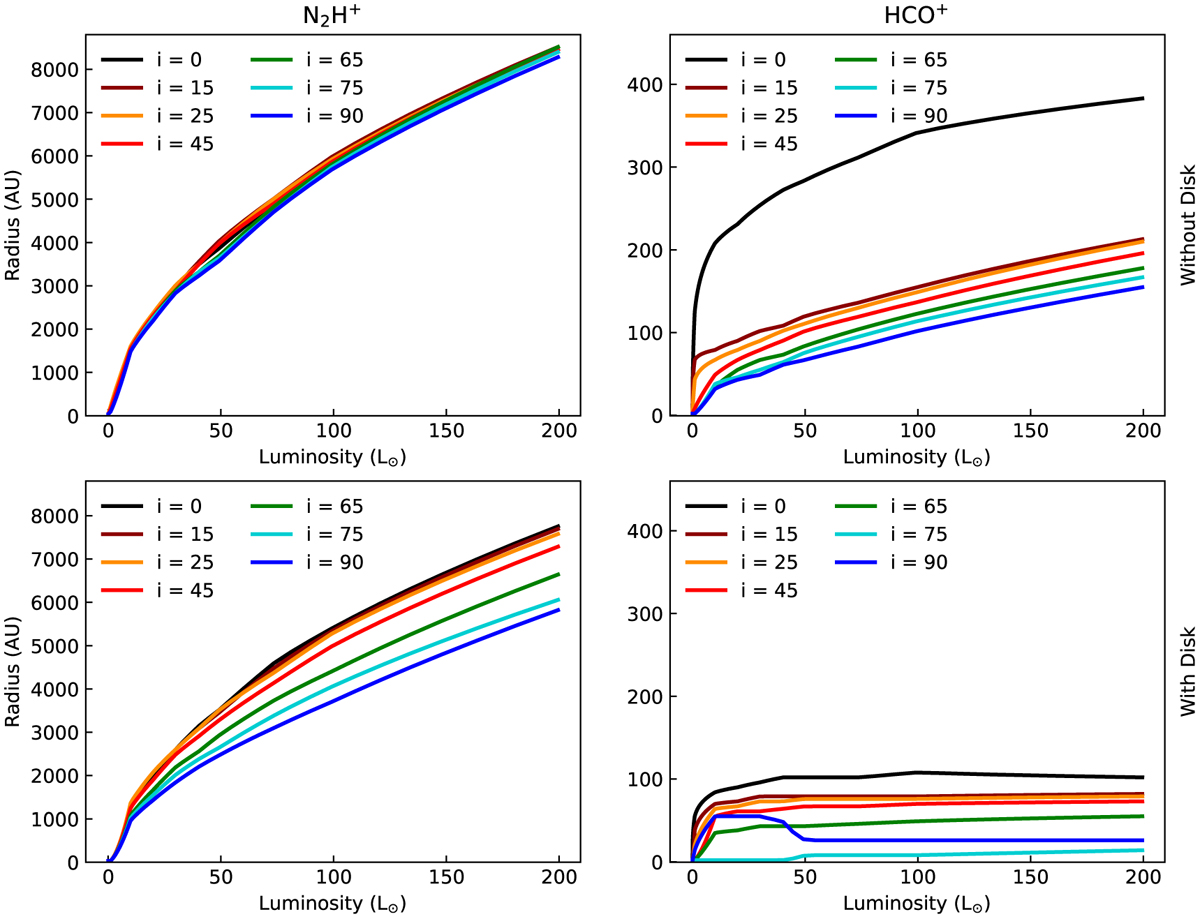
Fig. B.6
Download original image
Peak position of N2H+ (left) and HCO+ (right) versus luminosity for the disk, envelope and outflow cavity conditions of the fiducial models. The different colors indicate inclination. These curves are combined into the black curve shown in Figures 8 to 14. We note that the peak position of N2H+ does not show a clear trend with inclination, while the peak position of HCO+ decreases with increasing highlighting the importance of inclination in measuring an accurate water snowline location.
Current usage metrics show cumulative count of Article Views (full-text article views including HTML views, PDF and ePub downloads, according to the available data) and Abstracts Views on Vision4Press platform.
Data correspond to usage on the plateform after 2015. The current usage metrics is available 48-96 hours after online publication and is updated daily on week days.
Initial download of the metrics may take a while.