Open Access
Fig. 2
Download original image
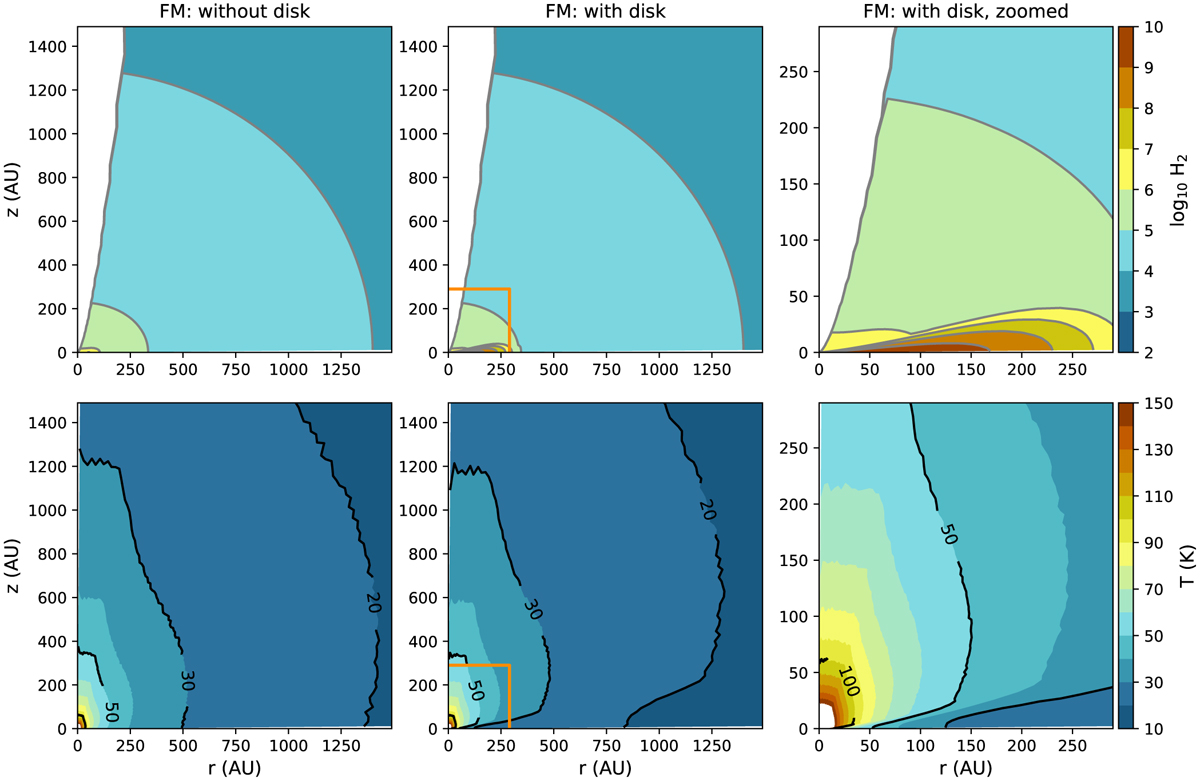
Density (top row) and temperature (bottom row) distribution of the two fiducial models: without a disk (left) and with a disk (center and right). The right column shows a zoom in of the fiducial model with the disk marked with an orange box in the center column.
Current usage metrics show cumulative count of Article Views (full-text article views including HTML views, PDF and ePub downloads, according to the available data) and Abstracts Views on Vision4Press platform.
Data correspond to usage on the plateform after 2015. The current usage metrics is available 48-96 hours after online publication and is updated daily on week days.
Initial download of the metrics may take a while.