Fig. 5
Download original image
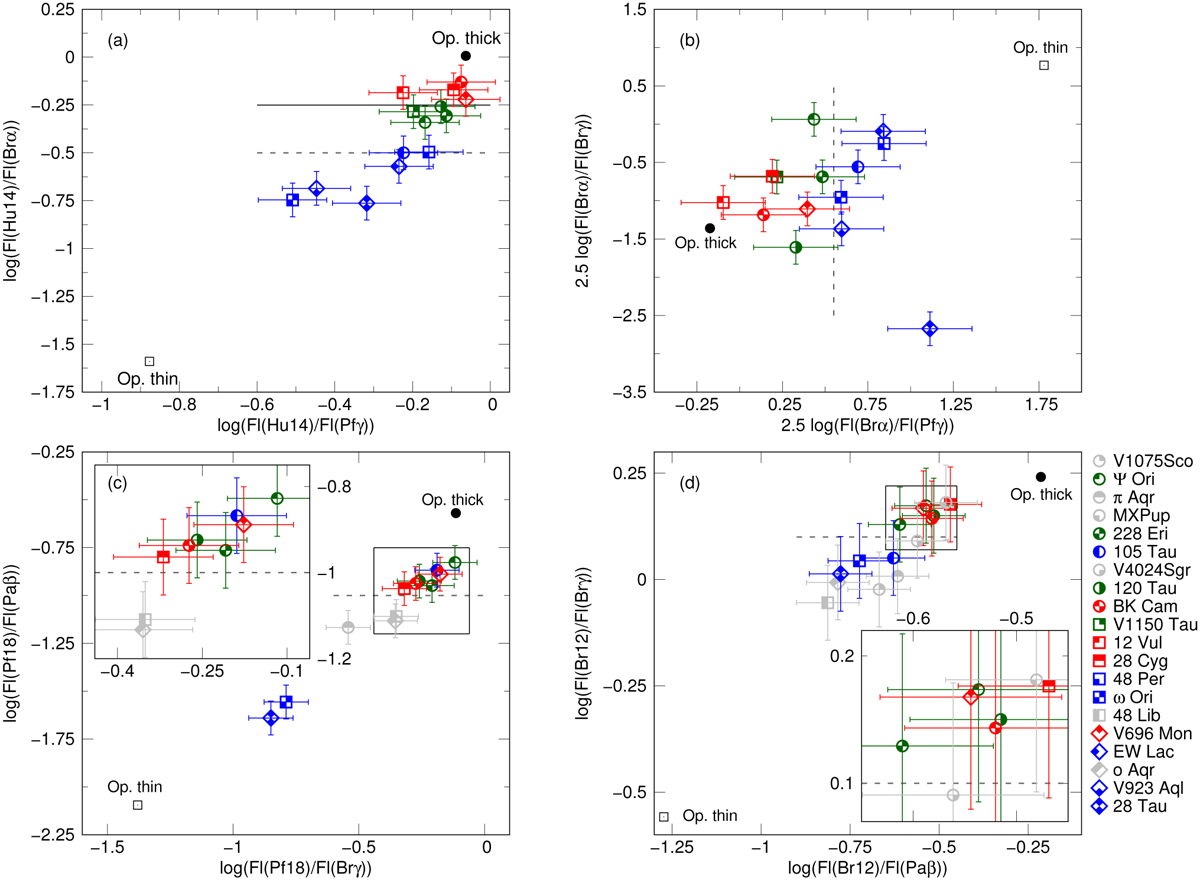
Flux-ratio diagrams based on the following lines: (a) Hul4 - Pfγ - Brα (Lenorzer’s); (b) Brα - Pfγ - Brγ (Granada’s – Persson & McGregor’s); (c) Pf18 - Brγ - Paβ; (d) Br12 - Paβ - Brγ. The symbols for each star are the same as in Fig. 4, but the colour represents the group the star belongs to: red symbols represent group I stars, blue symbols group II stars, and green symbols the transition group I-II. The grey symbols are for those stars without an L-band spectrum and no group classification. Zoomed-in views of the region where symbols overlap are plotted in panels c and d.
Current usage metrics show cumulative count of Article Views (full-text article views including HTML views, PDF and ePub downloads, according to the available data) and Abstracts Views on Vision4Press platform.
Data correspond to usage on the plateform after 2015. The current usage metrics is available 48-96 hours after online publication and is updated daily on week days.
Initial download of the metrics may take a while.