Open Access
Fig. 4
Download original image
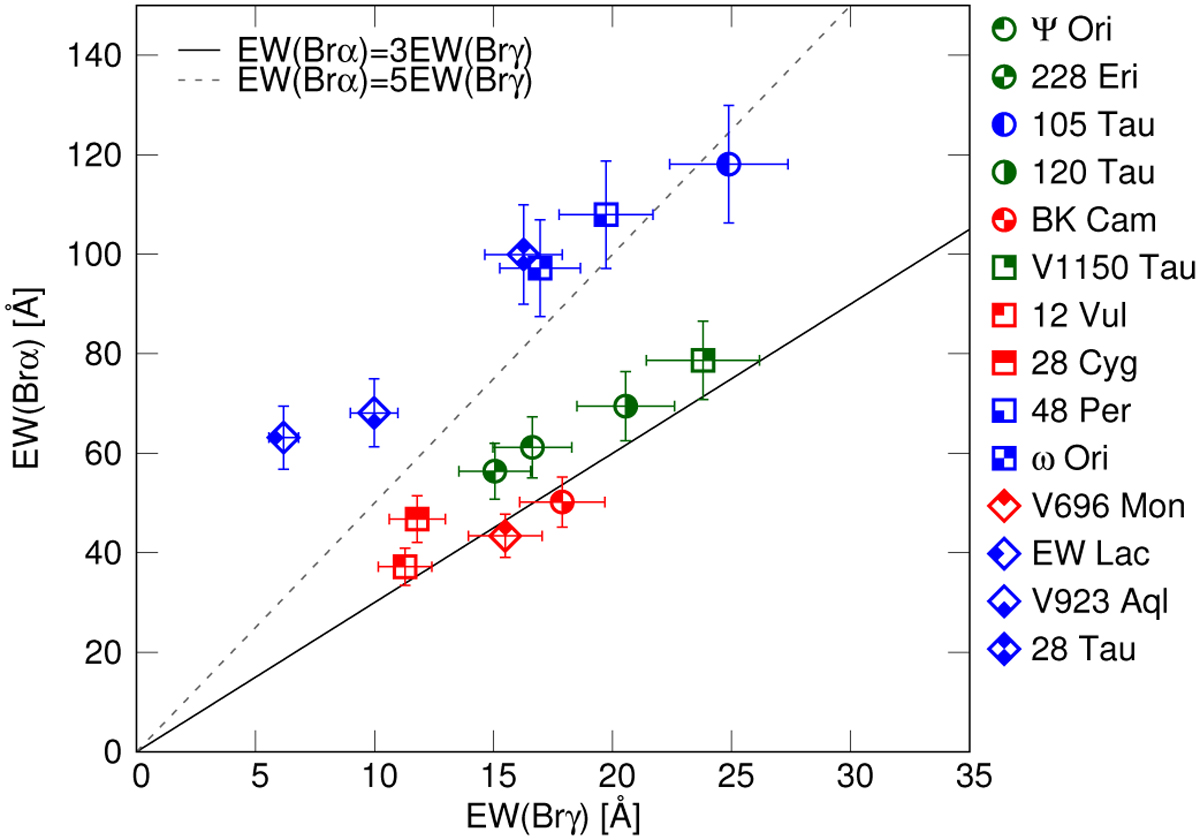
EW(Brα) versus EW(Brγ). Red symbols are for group I stars, group II stars are plotted in blue, and green symbols are for the intermediate group I-II. The relations EW(Brα) = 3 EW(Brγ) and EW(Brα) = 5 EW(Brγ) are plotted in continuous and dashed lines, respectively.
Current usage metrics show cumulative count of Article Views (full-text article views including HTML views, PDF and ePub downloads, according to the available data) and Abstracts Views on Vision4Press platform.
Data correspond to usage on the plateform after 2015. The current usage metrics is available 48-96 hours after online publication and is updated daily on week days.
Initial download of the metrics may take a while.