Fig. 2.
Download original image
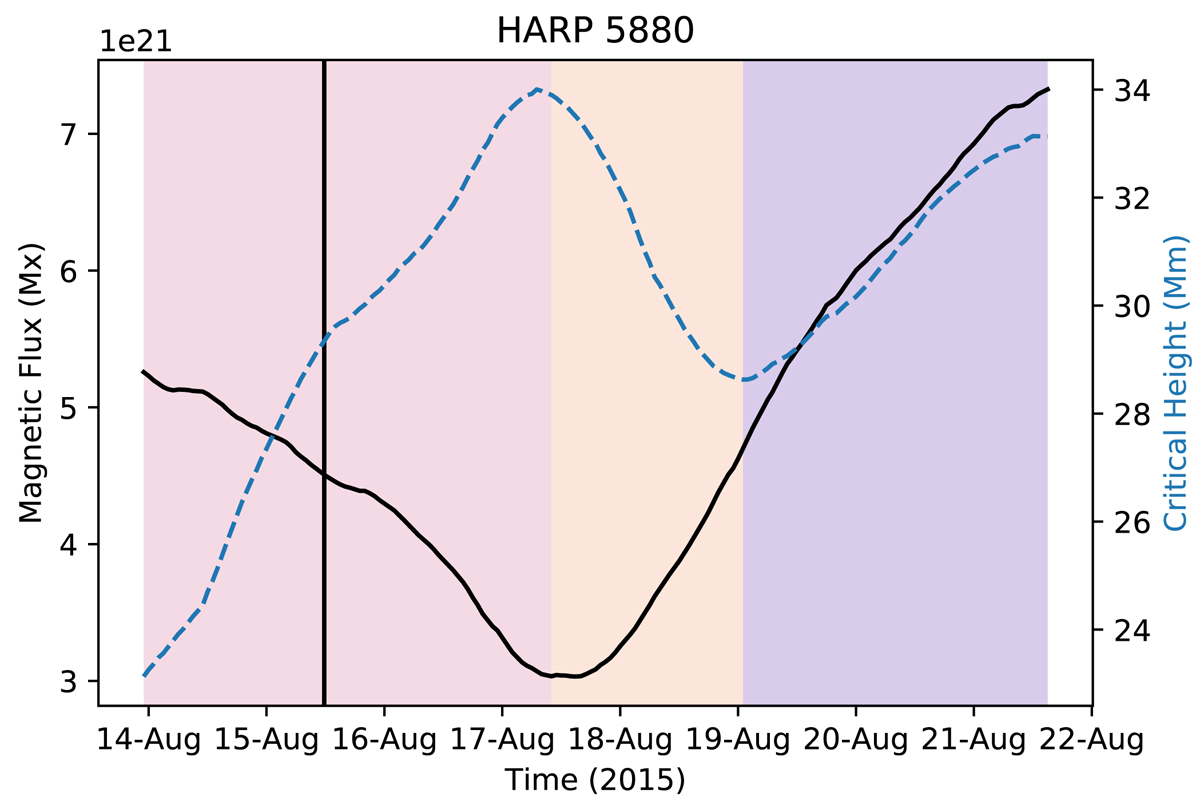
Unsigned active region magnetic flux (solid black curve) and critical height (dashed blue curve) in HARP 5880 against time. Initially, the magnetic flux decreases and the critical height increases (phase shaded in pink), then magnetic flux begins to increase and the critical height falls (shaded orange). As flux emergence continues, the critical height increases once more (shaded purple). The onset time of the CME observed in this region is given by the vertical black line.
Current usage metrics show cumulative count of Article Views (full-text article views including HTML views, PDF and ePub downloads, according to the available data) and Abstracts Views on Vision4Press platform.
Data correspond to usage on the plateform after 2015. The current usage metrics is available 48-96 hours after online publication and is updated daily on week days.
Initial download of the metrics may take a while.