Fig. 4
Download original image
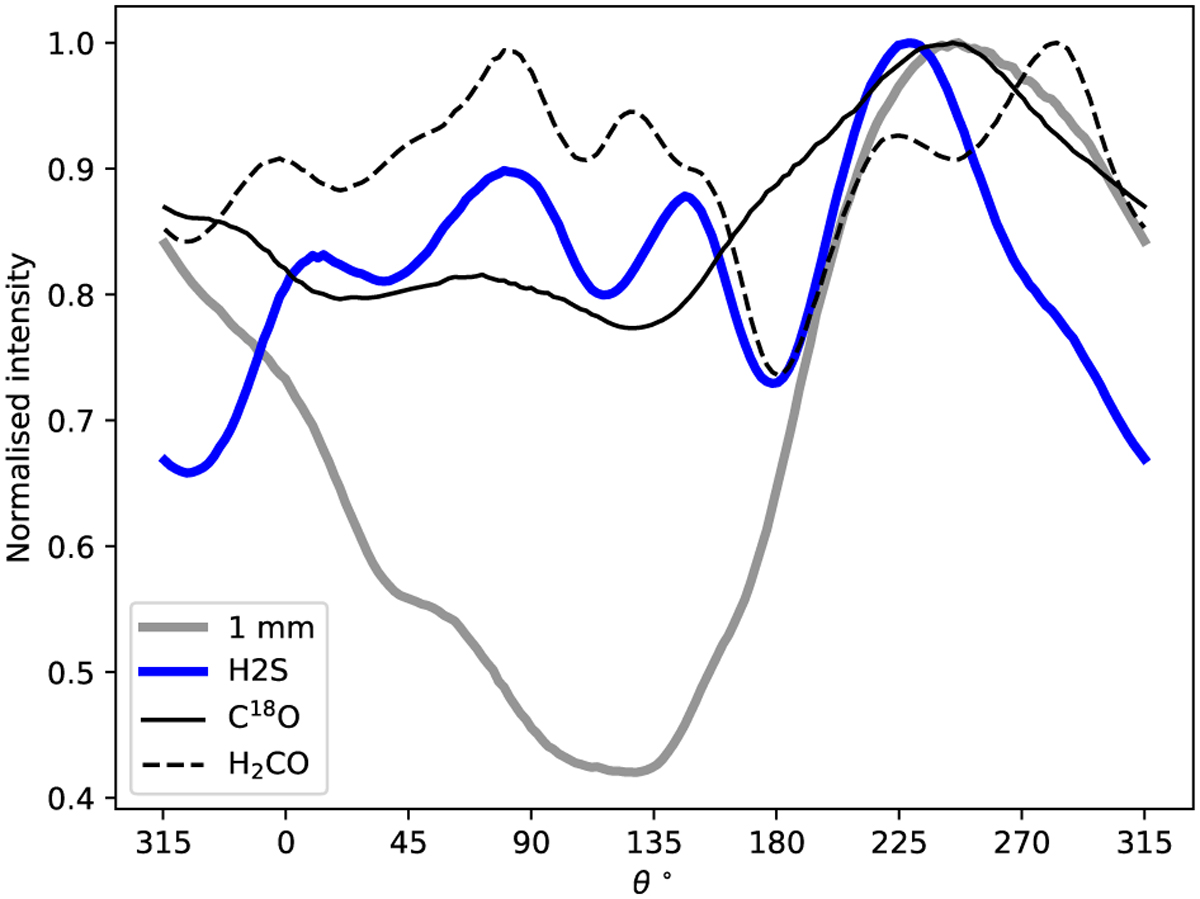
H2S azimuthal cuts compared to previous observations by this team. All the intensity maps have been convolved to match the beam size of our H2S emission line maps. The azimuthal profiles shown were computed at the distance of the emission peak of each species. The profiles were normalized with respect to their respective peaks.
Current usage metrics show cumulative count of Article Views (full-text article views including HTML views, PDF and ePub downloads, according to the available data) and Abstracts Views on Vision4Press platform.
Data correspond to usage on the plateform after 2015. The current usage metrics is available 48-96 hours after online publication and is updated daily on week days.
Initial download of the metrics may take a while.