Fig. 9
Download original image
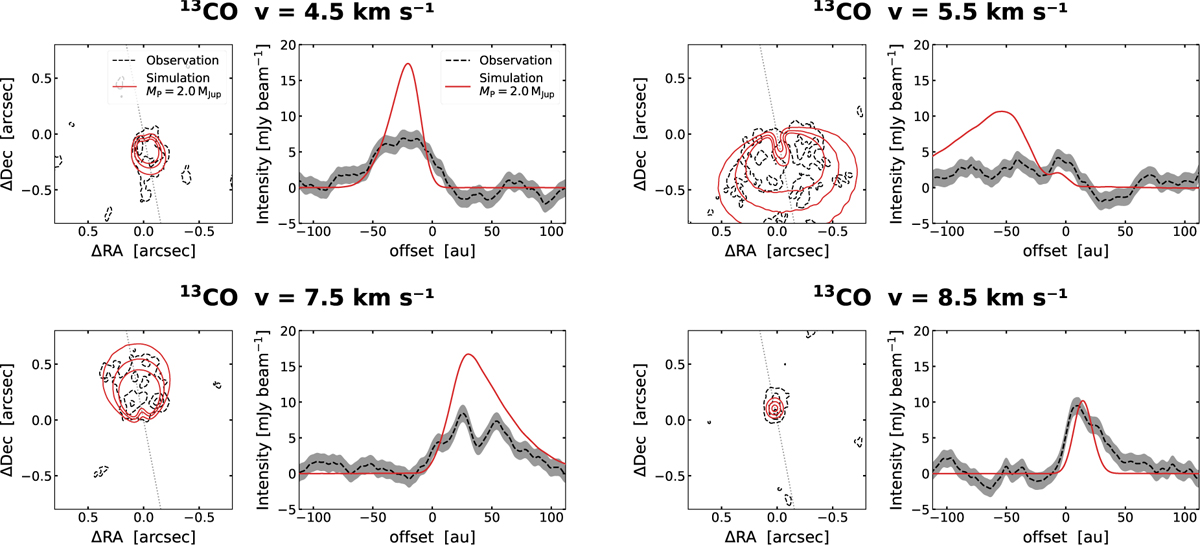
Contour levels (left panel in each subplot) at 3, 6, 9 mJy beam−1, and intensity profile comparisons (right panel in each subplot) between the 13CO observation and simulation with a 2.0MJup planet mass after 4 × 10⁴ yr, in the four channels not completely obscured by the cloud (v = 4.5, 5.5, 7.5, 8.5 km s−1). Intensity profiles are taken along the PA = 11° of the disk, and the direction is indicated by the dotted gray line in the contour levels plots. The uncertainty in the observation intensity profile is the 1σ noise level (1.2 mly beam−1).
Current usage metrics show cumulative count of Article Views (full-text article views including HTML views, PDF and ePub downloads, according to the available data) and Abstracts Views on Vision4Press platform.
Data correspond to usage on the plateform after 2015. The current usage metrics is available 48-96 hours after online publication and is updated daily on week days.
Initial download of the metrics may take a while.