Fig. 8
Download original image
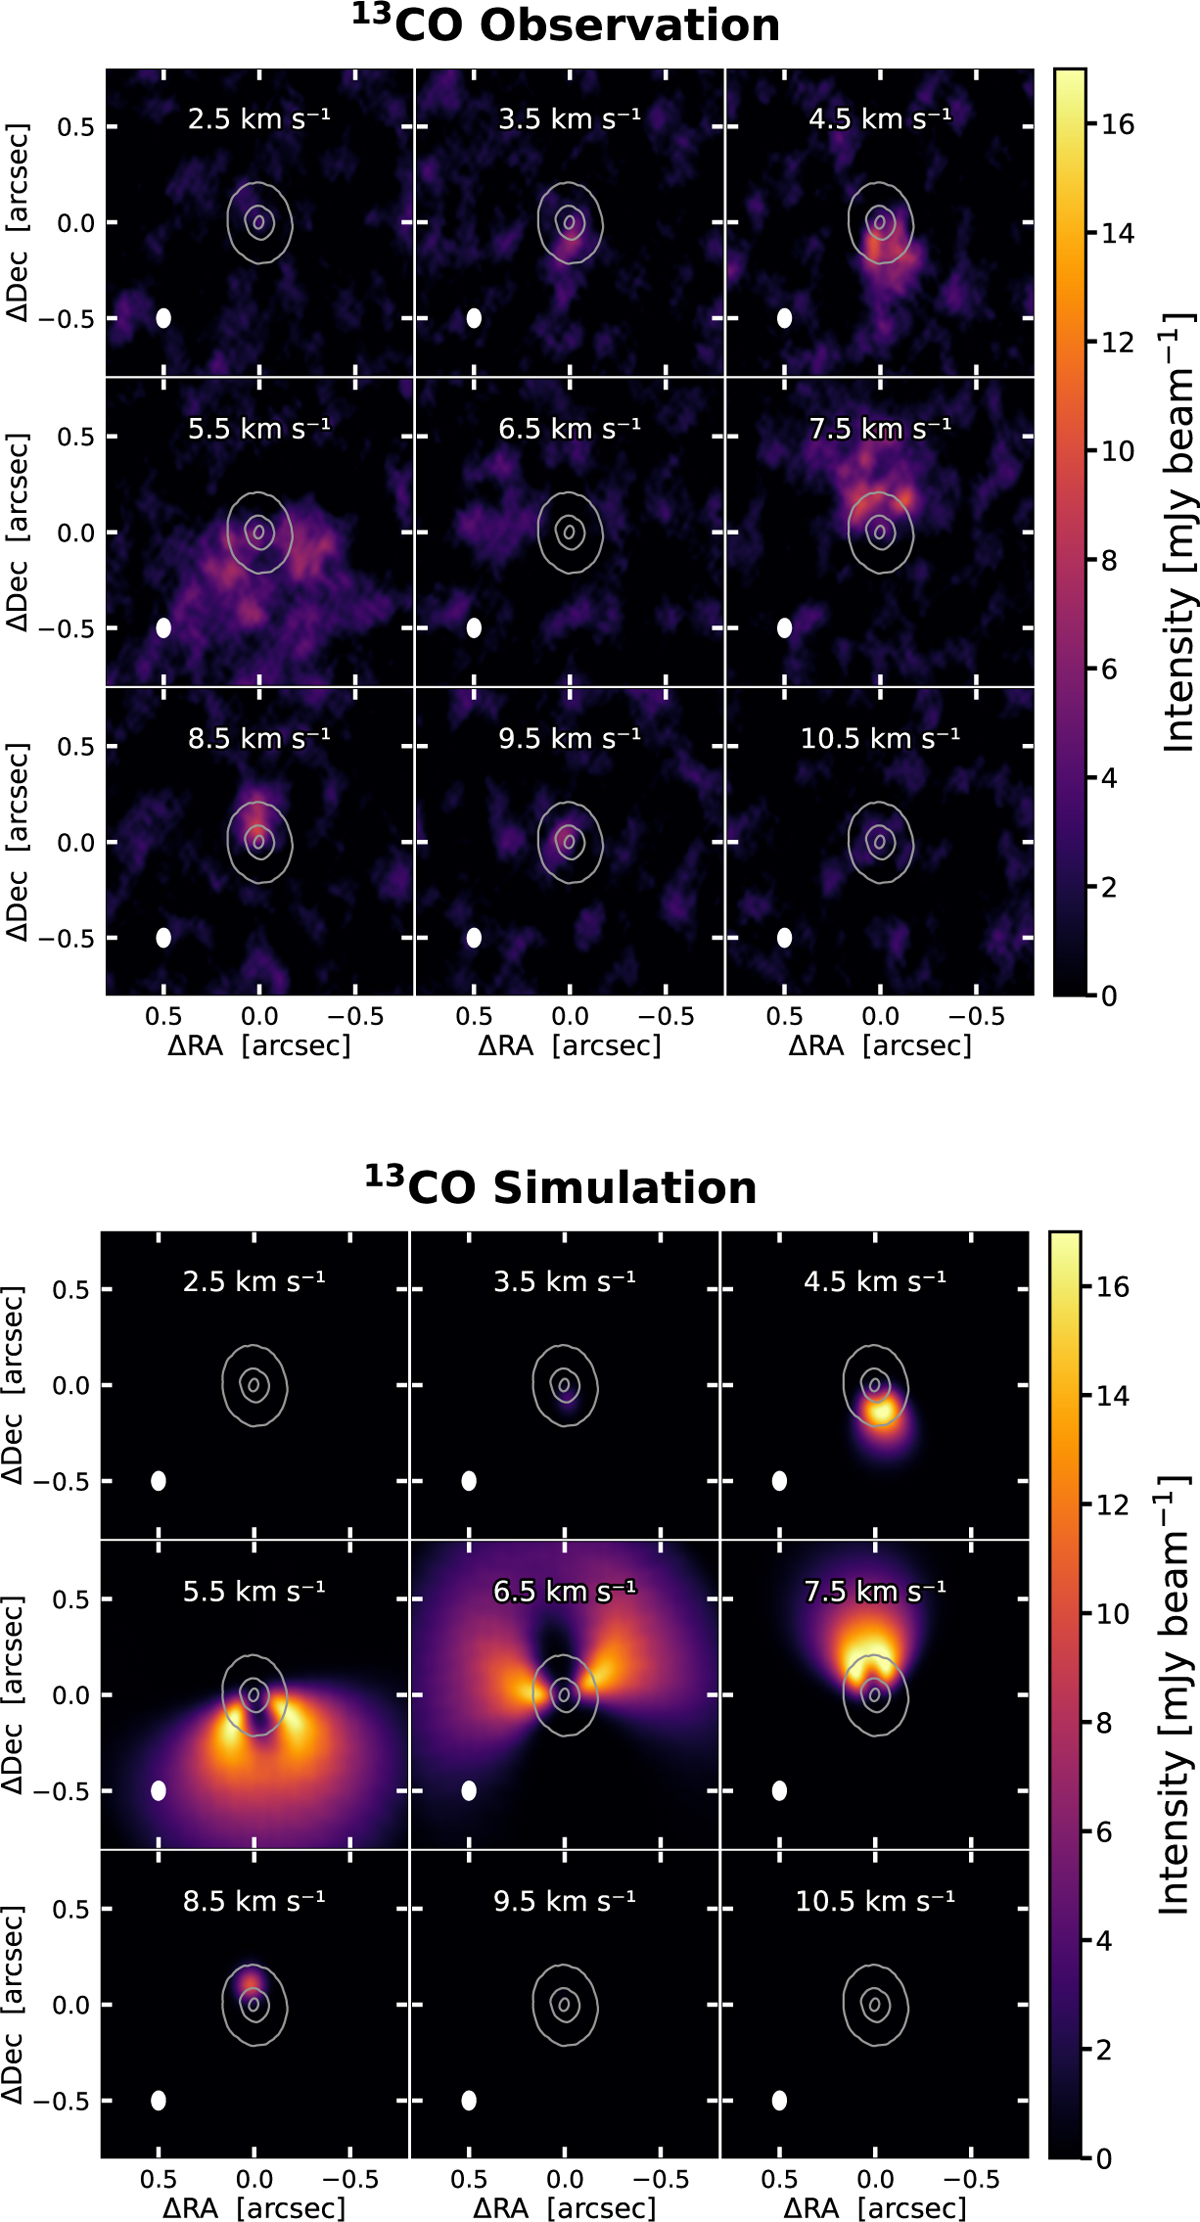
Comparison between the ALMA observation (top panels) and the synthetic images (bottom panels) of CIDA 1 13CO (J = 3-2) channel maps. Color scales are the same in the top and bottom panels. Synthetic images are obtained from the simulation with a final planet mass of 2.0 MJup after an evolution time of 4 × 10⁴ yr. We fixed the systemic velocity at 6.25 km s−1. The contour level traces the 15σ emission from the Band 7 continuum image. The velocity resolution is 1 km s−1, and the central velocities of each channel are indicated on the top of each panel. The synthesized beam (0.104″ × 0.076″, FWHM) is shown in the lower-left corner of each panel.
Current usage metrics show cumulative count of Article Views (full-text article views including HTML views, PDF and ePub downloads, according to the available data) and Abstracts Views on Vision4Press platform.
Data correspond to usage on the plateform after 2015. The current usage metrics is available 48-96 hours after online publication and is updated daily on week days.
Initial download of the metrics may take a while.