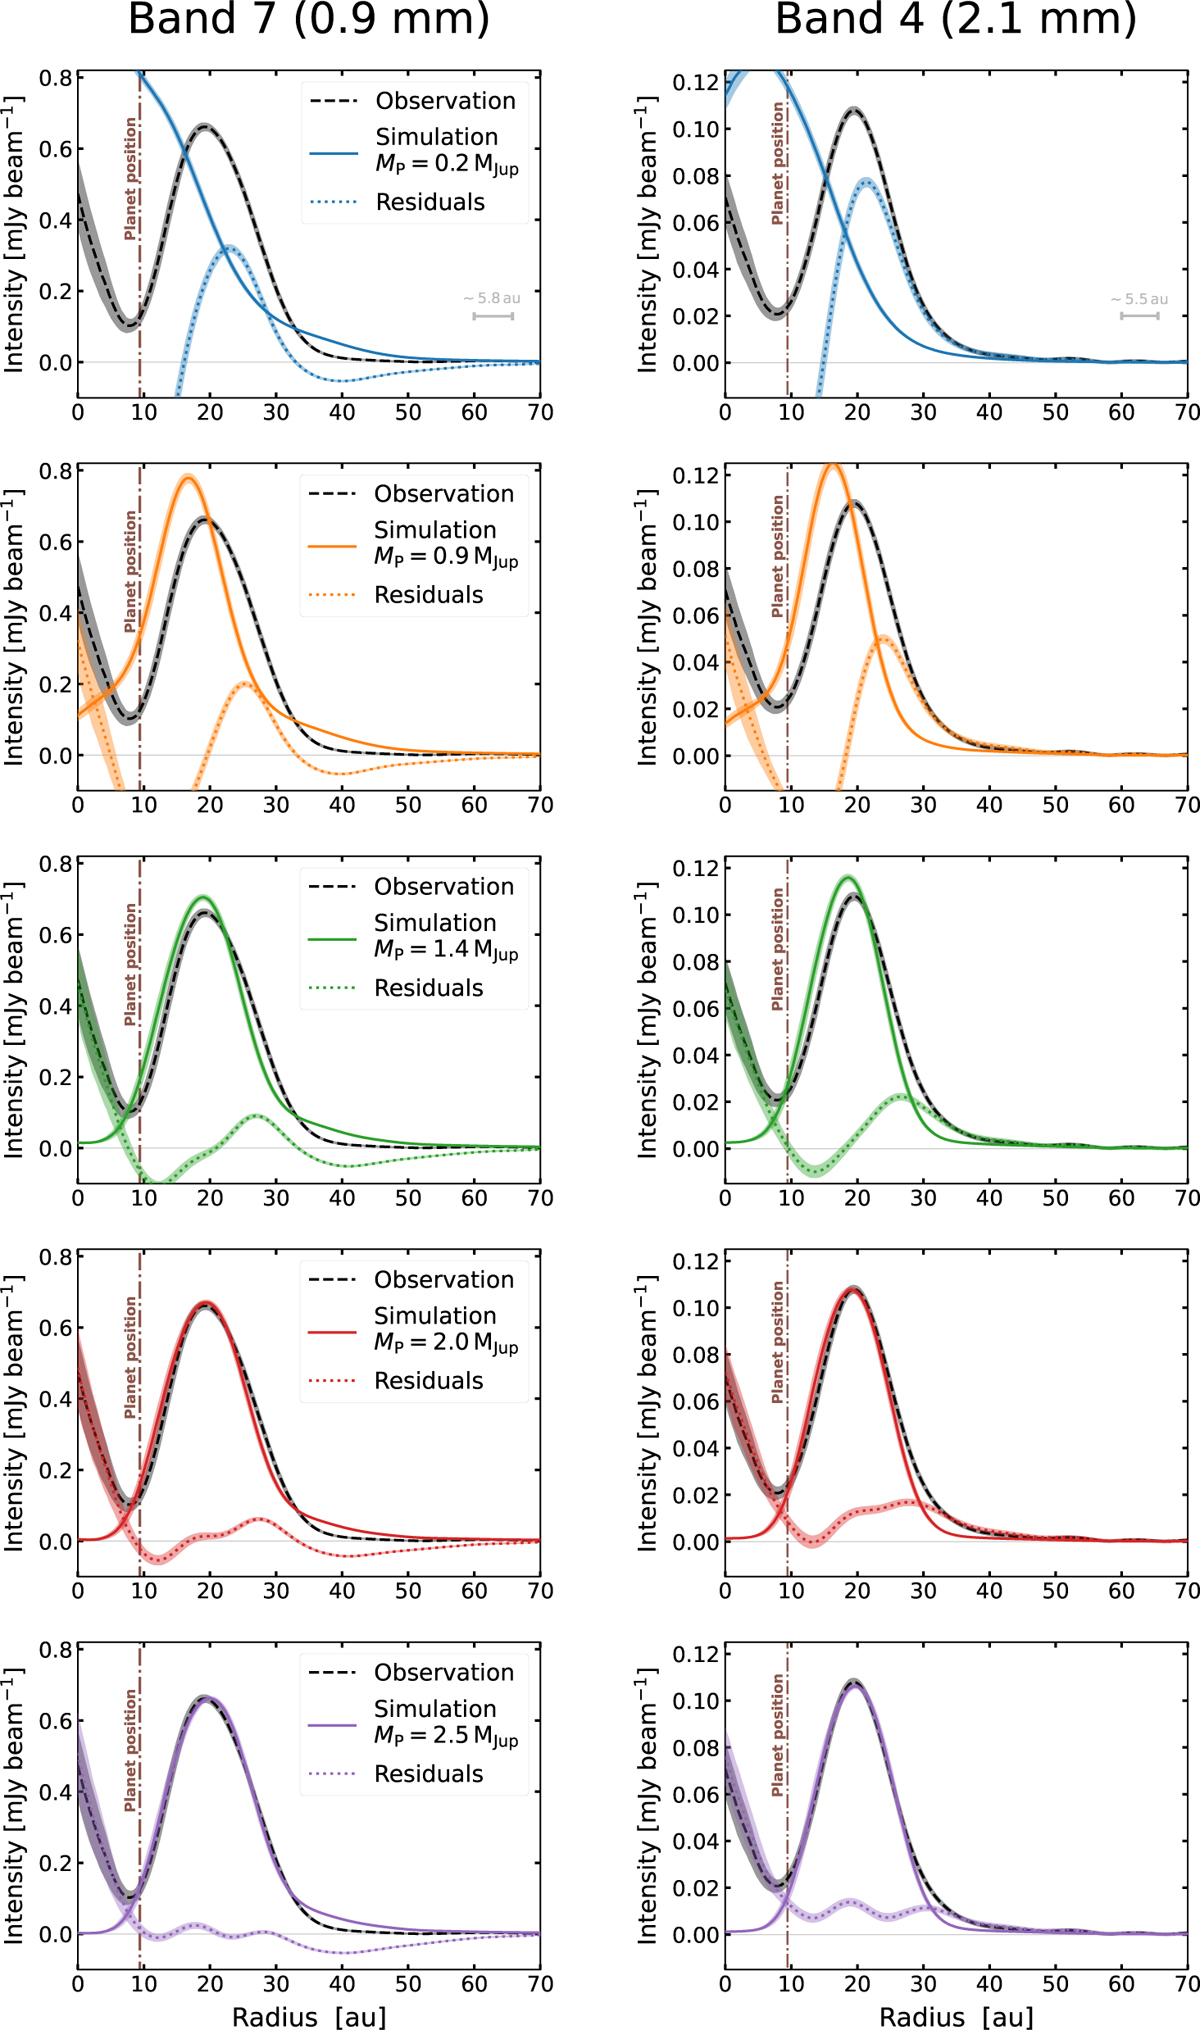
Fig. 5
Download original image
Comparison between radial profiles of azimuthalfy averaged intensities from the observations, simulations, and corresponding residuals, after the simulations have evolved for 4 × 10⁴ yr. The left-hand panels show results in Band 7, while the right-hand panels refer to Band 4. Each row contains the intensity profiles from the same simulation with a specific final planet mass, ranging from 0.2 MJup (top row) to 2.5 MJup (bottom row). The distance of the planet from the central star is indicated by the vertical dash-dotted brown line. The mean FWHMs of the synthesized beam in Band 7 and Band 4 are shown as horizontal bars in the top row panels. The radial intensity profiles are obtained by deprojecting the disk, using the disk inclination angle i = 37.5°, and dividing it into overlapping annuli, whose widths correspond to the averaged synthesized beam diameter. For each bin, uncertainties are calculated by taking the intensity standard deviation for each pixel in the annulus and dividing it by the square root of the number of synthesized beams contained in the area of the annulus.
Current usage metrics show cumulative count of Article Views (full-text article views including HTML views, PDF and ePub downloads, according to the available data) and Abstracts Views on Vision4Press platform.
Data correspond to usage on the plateform after 2015. The current usage metrics is available 48-96 hours after online publication and is updated daily on week days.
Initial download of the metrics may take a while.