Open Access
Fig. E.3
Download original image
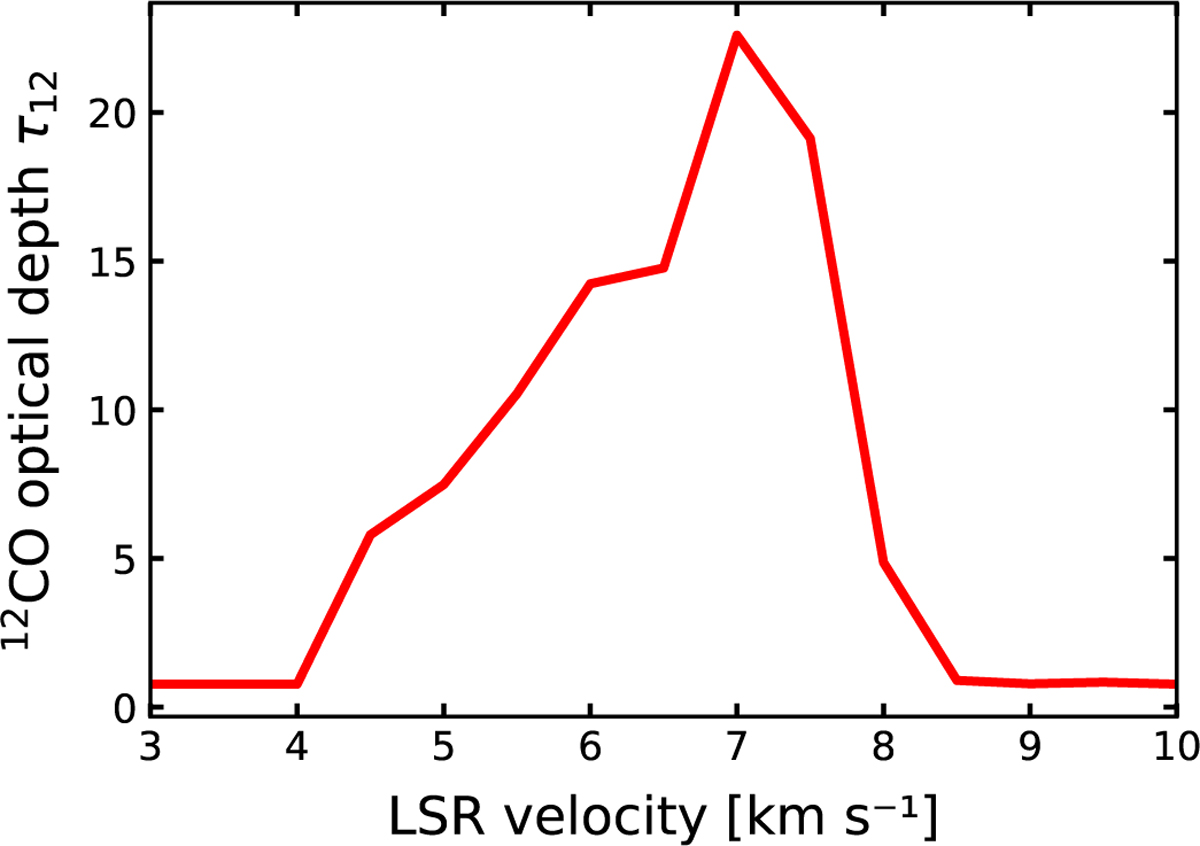
12CO (J = 3−2) optical depth in the Taurus subregion L1495 E, calculated from the spectra in Fig E.2 using Eq. E.1. We focus only on the velocity interval where line emission is detected. Bins replicate the central velocity and resolution of the observed 12CO channel maps.
Current usage metrics show cumulative count of Article Views (full-text article views including HTML views, PDF and ePub downloads, according to the available data) and Abstracts Views on Vision4Press platform.
Data correspond to usage on the plateform after 2015. The current usage metrics is available 48-96 hours after online publication and is updated daily on week days.
Initial download of the metrics may take a while.