Fig. E.1
Download original image
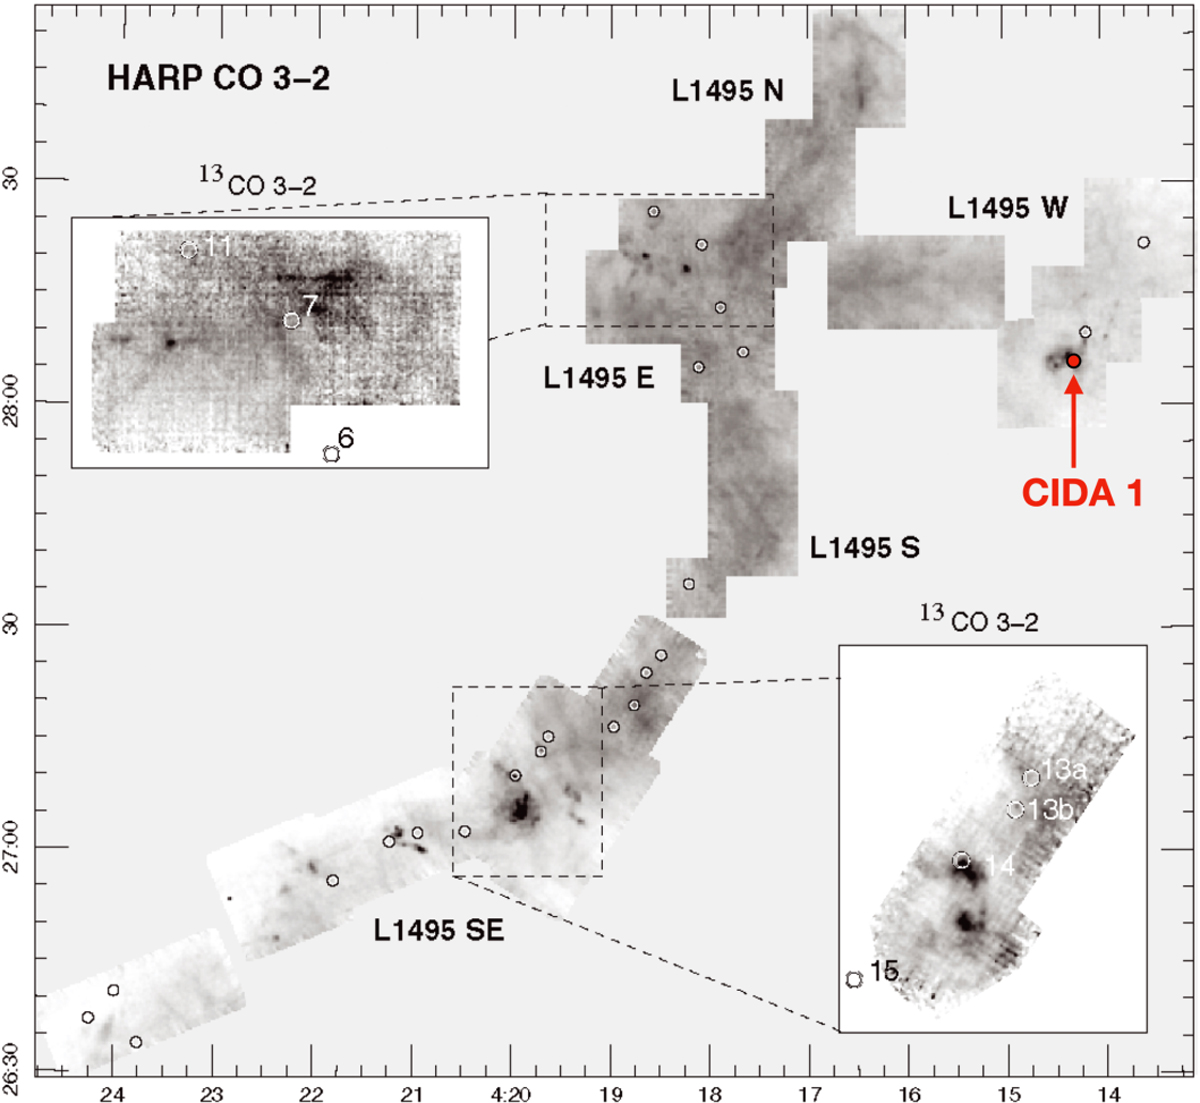
Map of the Taurus molecular cloud obtained by the James Clerk Maxwell Telescope using the 12CO (J = 3−2) emission (integrated between 2.0 and 11.0 km s−1). Areas also mapped with 13CO (J = 3−2) emission (integrated between 4.9 and 9.1 km s−1) are indicated by rectangular boxes. We calculated the optical depth property in the subregion L1495 E, whereas CIDA 1 is located in the region L1495 W. The image is adapted from right-hand panel of Fig. 1 in Davis et al. (2010).
Current usage metrics show cumulative count of Article Views (full-text article views including HTML views, PDF and ePub downloads, according to the available data) and Abstracts Views on Vision4Press platform.
Data correspond to usage on the plateform after 2015. The current usage metrics is available 48-96 hours after online publication and is updated daily on week days.
Initial download of the metrics may take a while.