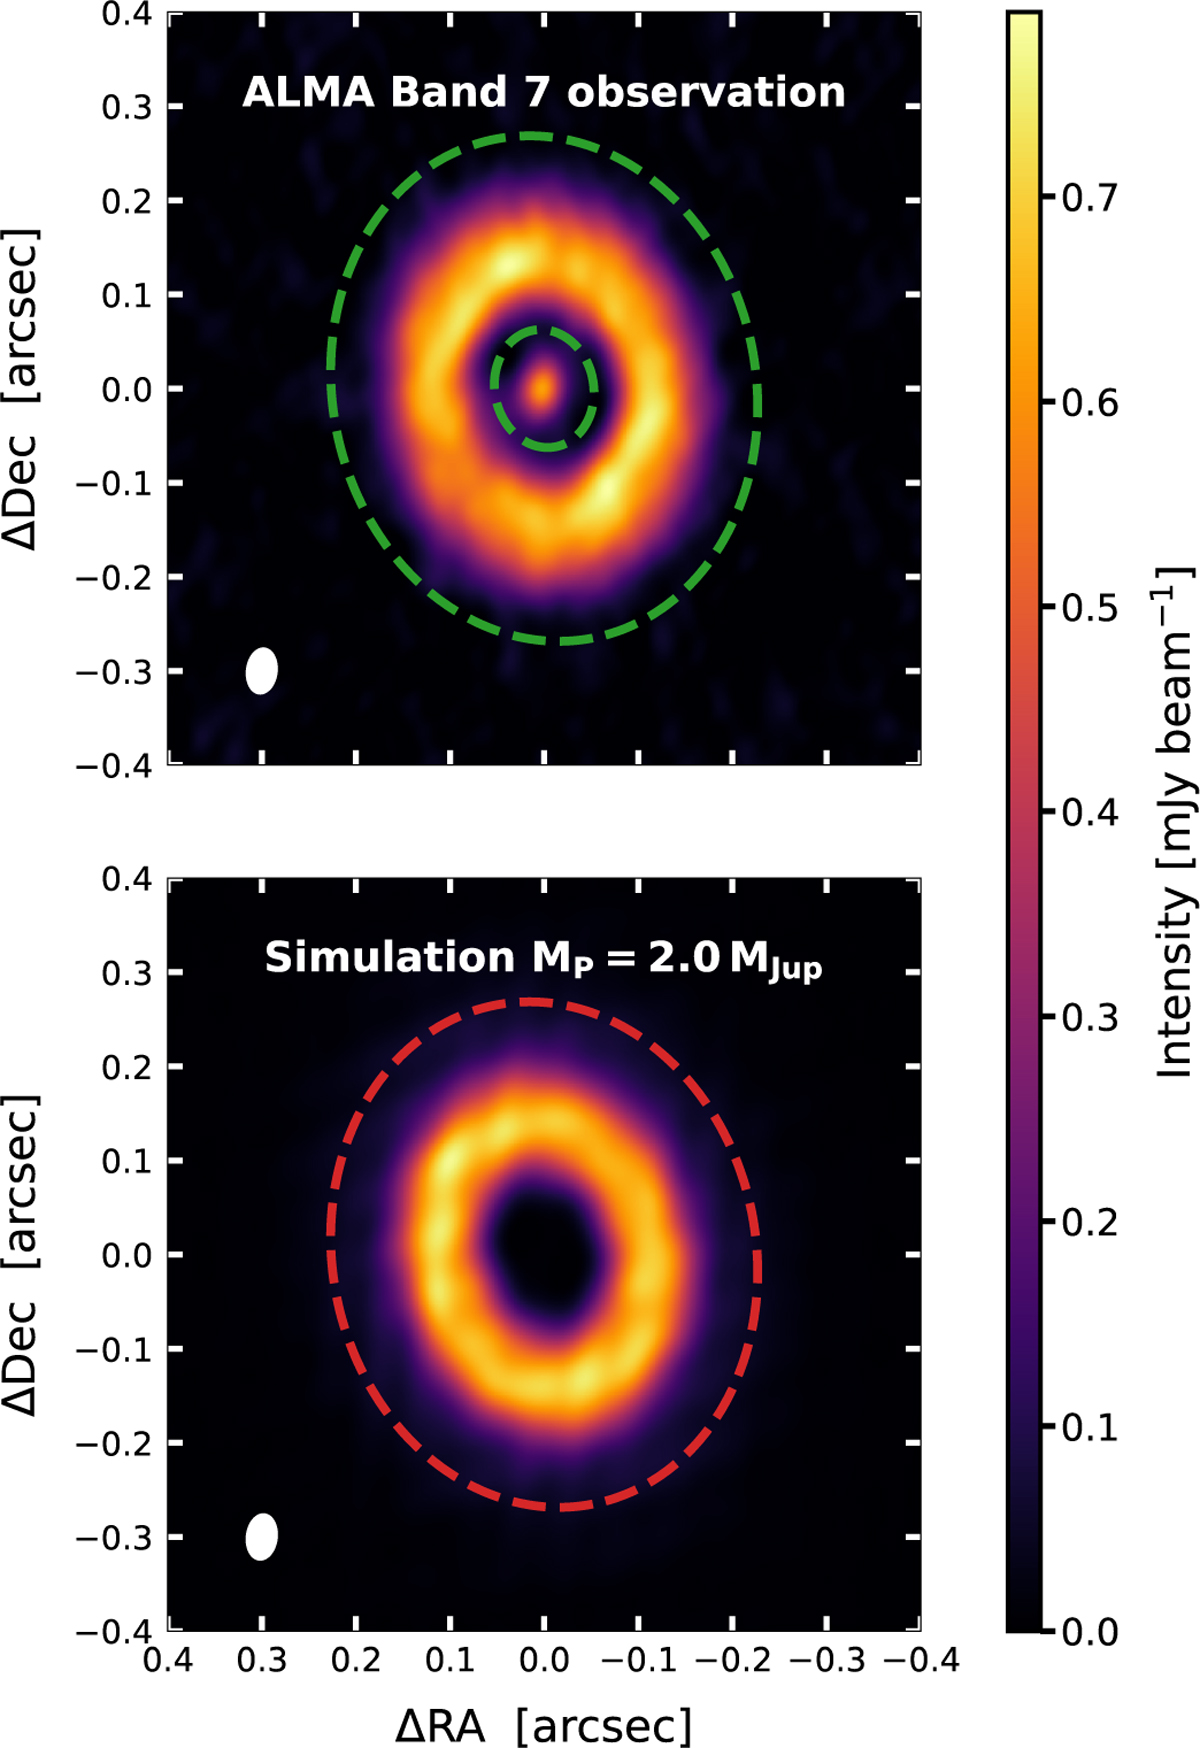
Fig. C.1
Download original image
Visual representation of the areas considered for the flux calculation to rescale the total dust masses in our simulations. We take as a reference the flux from the ALMA observation in Band 7, which is contained in the region between the two dashed green ellipses in the top panel. Then, we rescale the total dust mass in our simulations so that, from the synthetic images in Band 7, the flux within the dashed red ellipse shown in the bottom panel matches the reference flux from the observation. In the bottom panel, we display, as an example, the image obtained from the simulation where the planet reaches a mass of 2.0 MJup after 4 × 10⁴ yrs.
Current usage metrics show cumulative count of Article Views (full-text article views including HTML views, PDF and ePub downloads, according to the available data) and Abstracts Views on Vision4Press platform.
Data correspond to usage on the plateform after 2015. The current usage metrics is available 48-96 hours after online publication and is updated daily on week days.
Initial download of the metrics may take a while.