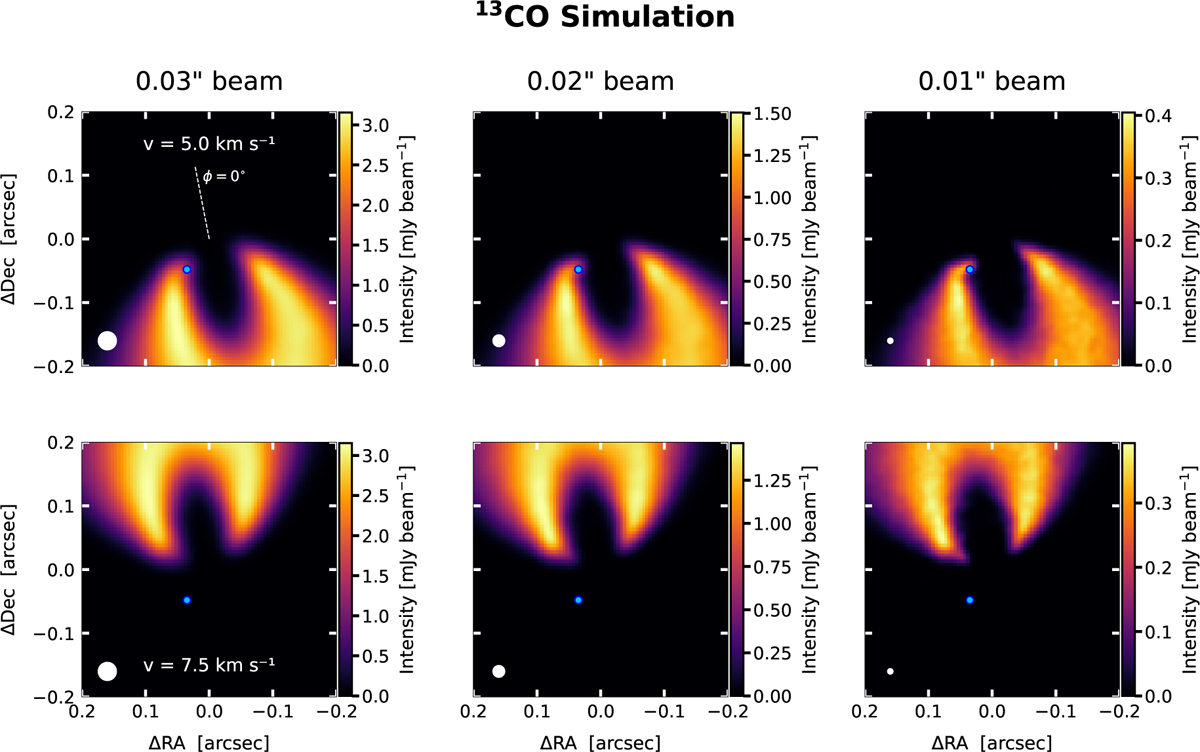
Fig. 11
Download original image
Synthetic images of the 13CO (J = 3−2) emission from our simulation with MP = 2.0 MJup after an evolution time of 4 × 10⁴ yr. We compute the images at two different channels: v = 5.0 km s−1 (top panels) and v = 7.5km s−1 (bottom panels), with a velocity resolution of 0.5km s−1. We use three different circular beam sizes: 0.03″, 0.02″, and 0.01″ (FWHMs, from left to right), indicated by the white circles in the lower-left cornel of each plot. The blue dot represents the planet position at the azimuthal angle ϕ = 145° (relative to the angle ϕ = 0°, which is located at the disk major axis indicated by the dashed white line in the top-left panel).
Current usage metrics show cumulative count of Article Views (full-text article views including HTML views, PDF and ePub downloads, according to the available data) and Abstracts Views on Vision4Press platform.
Data correspond to usage on the plateform after 2015. The current usage metrics is available 48-96 hours after online publication and is updated daily on week days.
Initial download of the metrics may take a while.