Fig. 10
Download original image
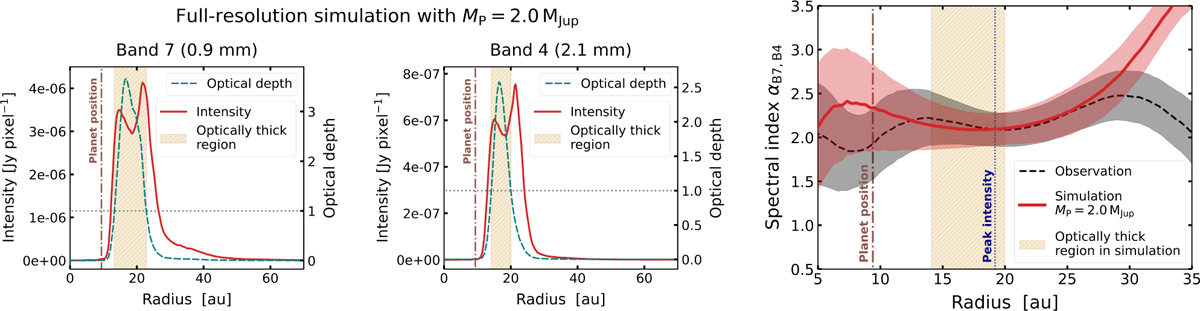
Optical depth in our models and comparison between observed and simulated spectral indices. Left and central panels: Azimuthally averaged radial profiles of the optical depth along the line of sight and the intensities from the full-resolution dust emission image of the simulation (i.e., not convoluted with the synthesized beam) with a final planet mass of 2.0 MJup after 4 × 10⁴ yr, in Band 7 and Band 4. The vertical dash-dotted brown line indicates the location of the planet, and the horizontal dotted gray line marks the optical depth τ = 1 level. The region where the emission is optically thick (optical depth τ ≥ 1) is shown in beige. Right panel: azimuthally averaged radial profiles of the spectral index from the ALMA observation and our simulation with a final planet mass of 2.0 MJup after 4 × 10⁴ yr. Values are obtained using Eq. (5) and the synthetic image intensity profiles in Fig. 5. Uncertainties include the original error in the intensity profiles and a 10% flux error due to calibration. As a reference, the distance of the planet from the central star is indicated by the vertical dash-dotted brown line, and the position of the peak intensity is displayed by the vertical dotted blue line. The beige-shaded area marks the radii where the full-resolution simulated emission is optically thick (τ ≥ 1) in both Band 7 and Band 4.
Current usage metrics show cumulative count of Article Views (full-text article views including HTML views, PDF and ePub downloads, according to the available data) and Abstracts Views on Vision4Press platform.
Data correspond to usage on the plateform after 2015. The current usage metrics is available 48-96 hours after online publication and is updated daily on week days.
Initial download of the metrics may take a while.