Fig. 9
Download original image
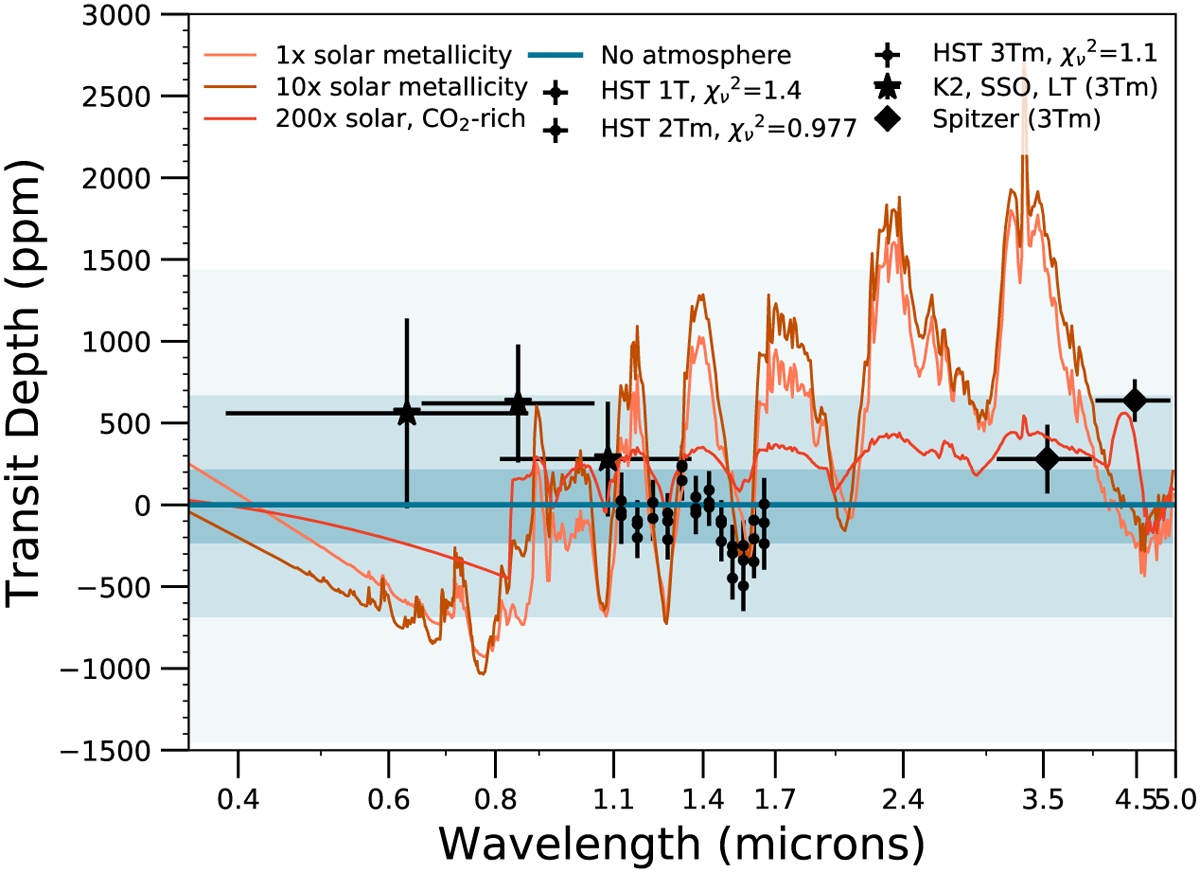
As in Fig. 8 (bottom) with the addition of K2/SSO/LT data points (Ducrot et al. 2018) and Spitzer IRAC Ch. 1 and Ch. 2 data (Ducrot et al. 2020), shown here corrected for stellar contamination scenario 3Tm, the “best-fit” configuration. We also include our carbon-dioxide-rich atmospheric model to compare against the data, though in all scenarios for the stellar photosphere, we minimize the χ2 with the flat “high mean molecular weight/no atmosphere” model, which we report as ![]() after each transit depth scenario in the legend. We note that we have applied offsets to the K2, SSO, LT, and Spitzer data, as discussed in the text.
after each transit depth scenario in the legend. We note that we have applied offsets to the K2, SSO, LT, and Spitzer data, as discussed in the text.
Current usage metrics show cumulative count of Article Views (full-text article views including HTML views, PDF and ePub downloads, according to the available data) and Abstracts Views on Vision4Press platform.
Data correspond to usage on the plateform after 2015. The current usage metrics is available 48-96 hours after online publication and is updated daily on week days.
Initial download of the metrics may take a while.