Fig. A.7
Download original image
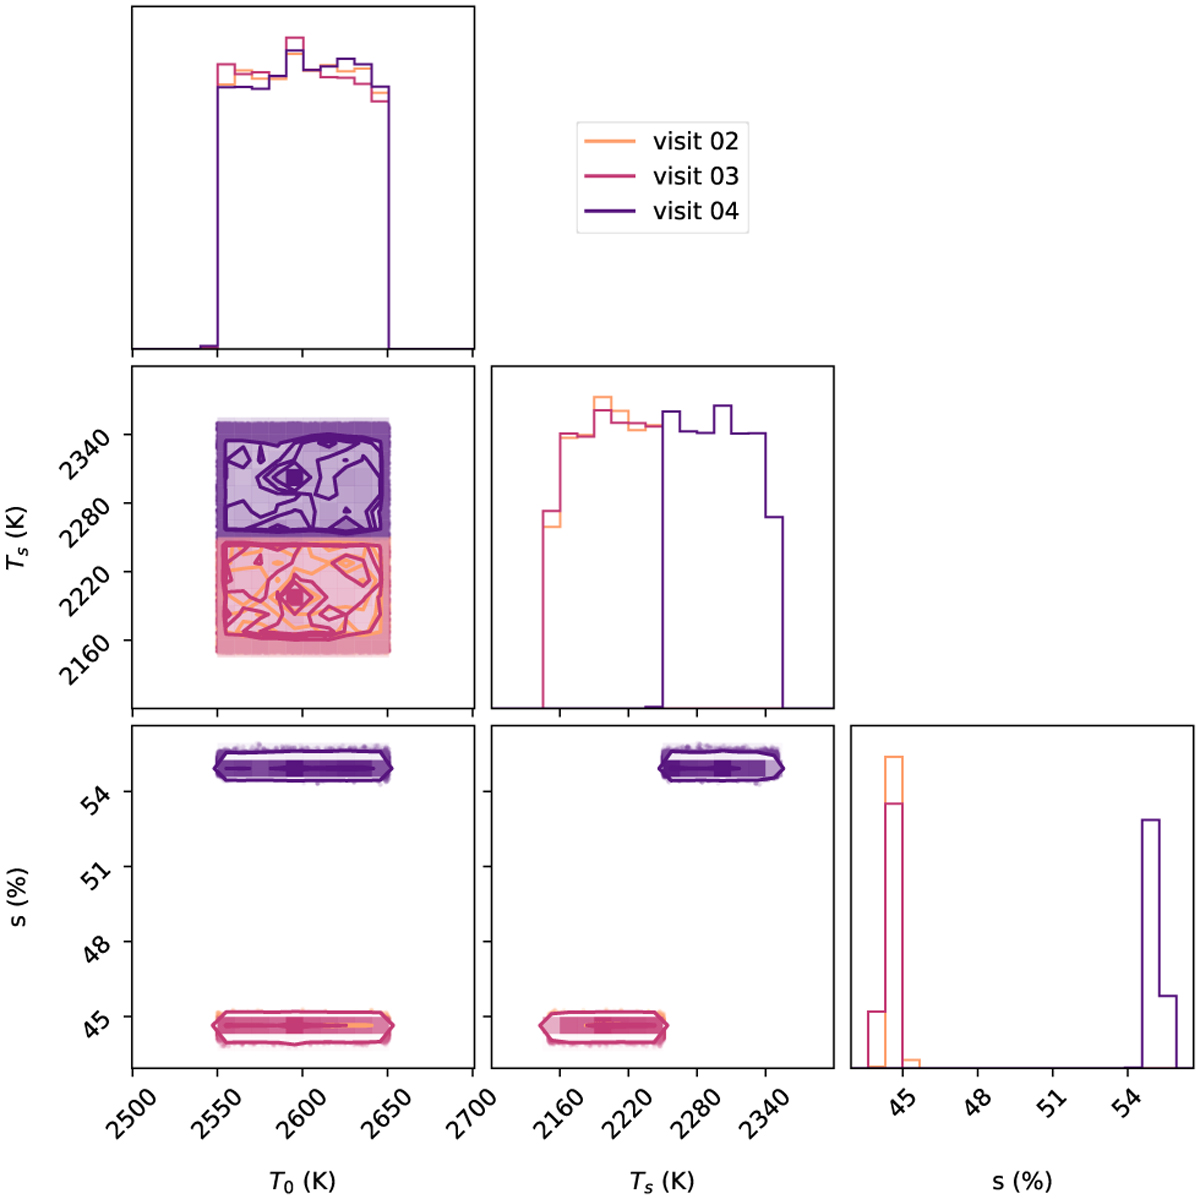
Corner plot of the parameters inferred in the 2T model. Here T0 denotes the temperature of the quiescent component and Ts the temperature of the cooler component, with s its covering fraction. Visit 3 is better modeled with a cooler component at ~2300K instead of ~2200K for visit 1 and 2. We assume that this is likely due to the coarse grid of temperatures of our model, as the likelihood distribution seems to have a single maximum (see Figure A.8).
Current usage metrics show cumulative count of Article Views (full-text article views including HTML views, PDF and ePub downloads, according to the available data) and Abstracts Views on Vision4Press platform.
Data correspond to usage on the plateform after 2015. The current usage metrics is available 48-96 hours after online publication and is updated daily on week days.
Initial download of the metrics may take a while.