Fig. A.5
Download original image
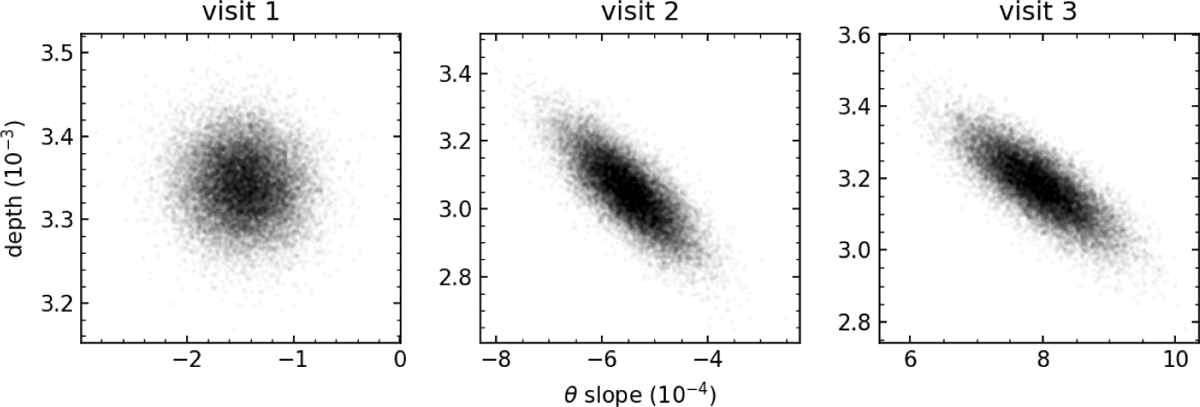
Correlation between the slope in time and transit depth of the systematic error model. This figure was produced by sampling the likelihood distribution of our model against its parameters using a Markov Chain Mont Carlo on the white-light curves. It shows that, apart from visit 1 where the transit mid-time is observed, the transit depth is correlated with the slope in time θ used to model systematics over the duration of a visit (a shallower slope is compensated by a deeper transit). As only the ingress and egress are observed in visits 2 and 3, we assume that the spectrum-to-spectrum differences in our study are partially due to this effect. However, as the visits-combined analysis contains a complete transit (in phase), the slope of the systematic error model should be less correlated with the transit depth, as in visit 1, which is confirmed by the similarity observed between visit 1 and the global spectrum (Figure 3)
Current usage metrics show cumulative count of Article Views (full-text article views including HTML views, PDF and ePub downloads, according to the available data) and Abstracts Views on Vision4Press platform.
Data correspond to usage on the plateform after 2015. The current usage metrics is available 48-96 hours after online publication and is updated daily on week days.
Initial download of the metrics may take a while.