Fig. A.1
Download original image
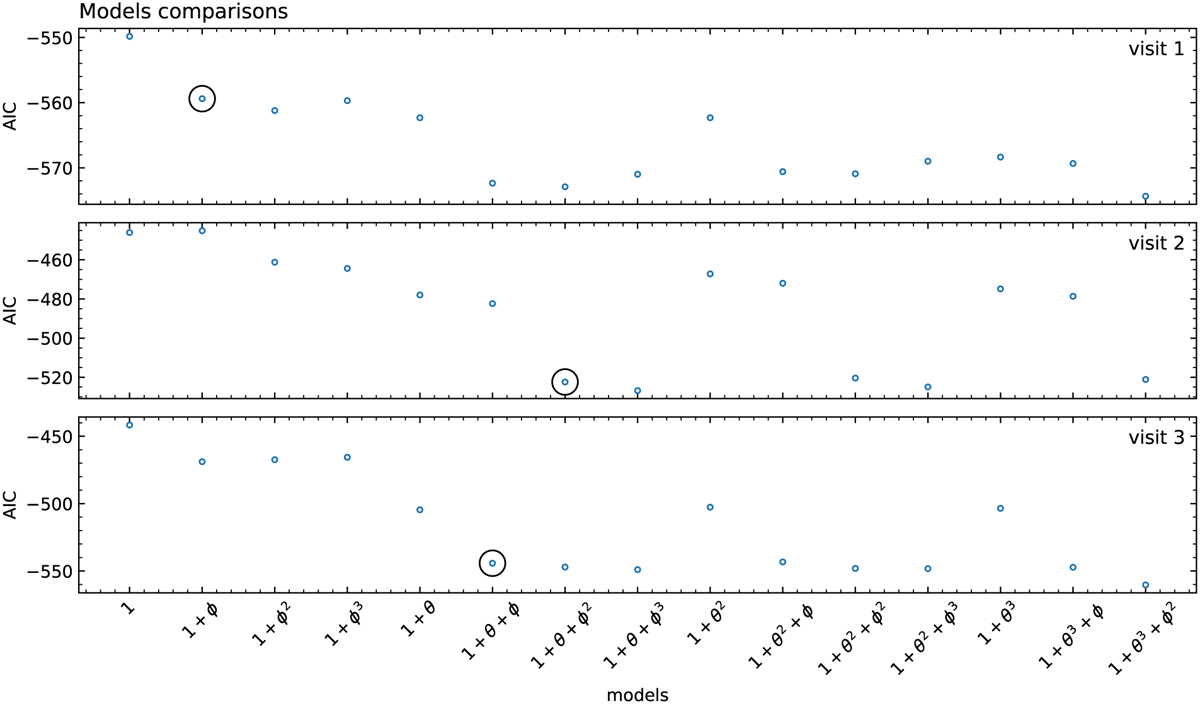
Model comparison for visits 1, 2, and 3. The x-axis represents the systematic error model where 1 designates a constant, θn a polynomial order n of θ, and ϕm a polynomial order m of ϕ. The best model is circled. For one model to be considered better than another, we require that the AIC difference between it and the others be greater than 20.
Current usage metrics show cumulative count of Article Views (full-text article views including HTML views, PDF and ePub downloads, according to the available data) and Abstracts Views on Vision4Press platform.
Data correspond to usage on the plateform after 2015. The current usage metrics is available 48-96 hours after online publication and is updated daily on week days.
Initial download of the metrics may take a while.