Fig. 3.
Download original image
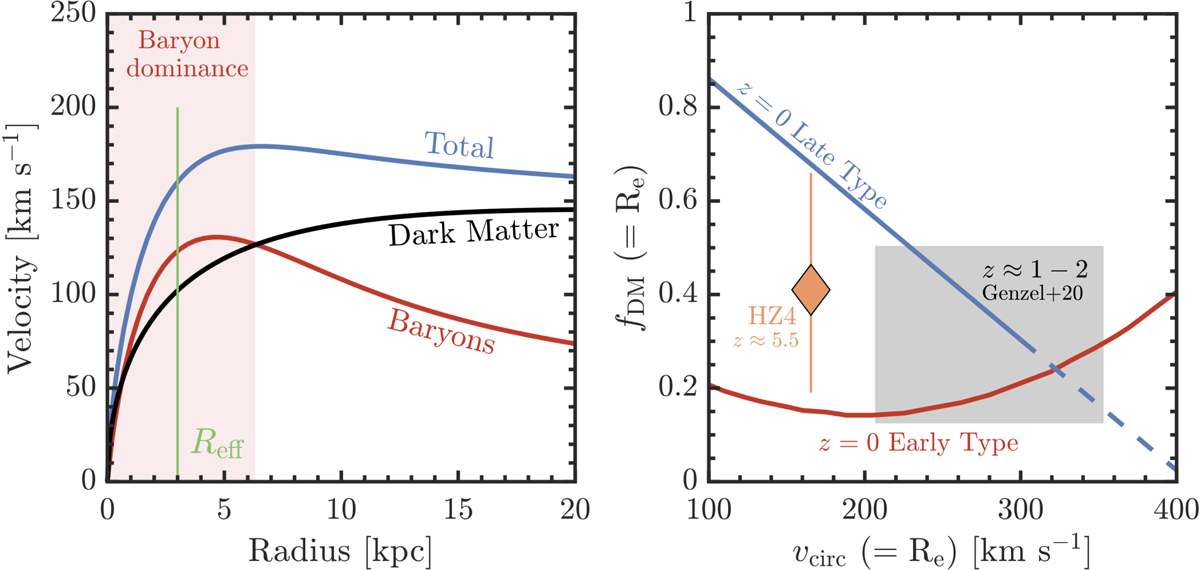
Kinematic modeling of the rotation curve of HZ4. Left: intrinsic rotation curve (corrected by inclination) of HZ4 for baryons (red), dark matter (black), and total (blue) from the best-fit model. The green vertical line shows the Re, and the red colored box represents the spatial scales of baryon dominance in HZ4. Right: dark-matter fraction within Re of HZ4 (orange diamond), main-sequence, star-forming galaxies at z ≈ 1 − 2 (gray box; Genzel et al. 2020), and the best linear fit to z ∼ 0 late-type galaxies (blue line), and z ∼ 0 ATLAS-3D early-type galaxies (red curve; Cappellari 2016).
Current usage metrics show cumulative count of Article Views (full-text article views including HTML views, PDF and ePub downloads, according to the available data) and Abstracts Views on Vision4Press platform.
Data correspond to usage on the plateform after 2015. The current usage metrics is available 48-96 hours after online publication and is updated daily on week days.
Initial download of the metrics may take a while.