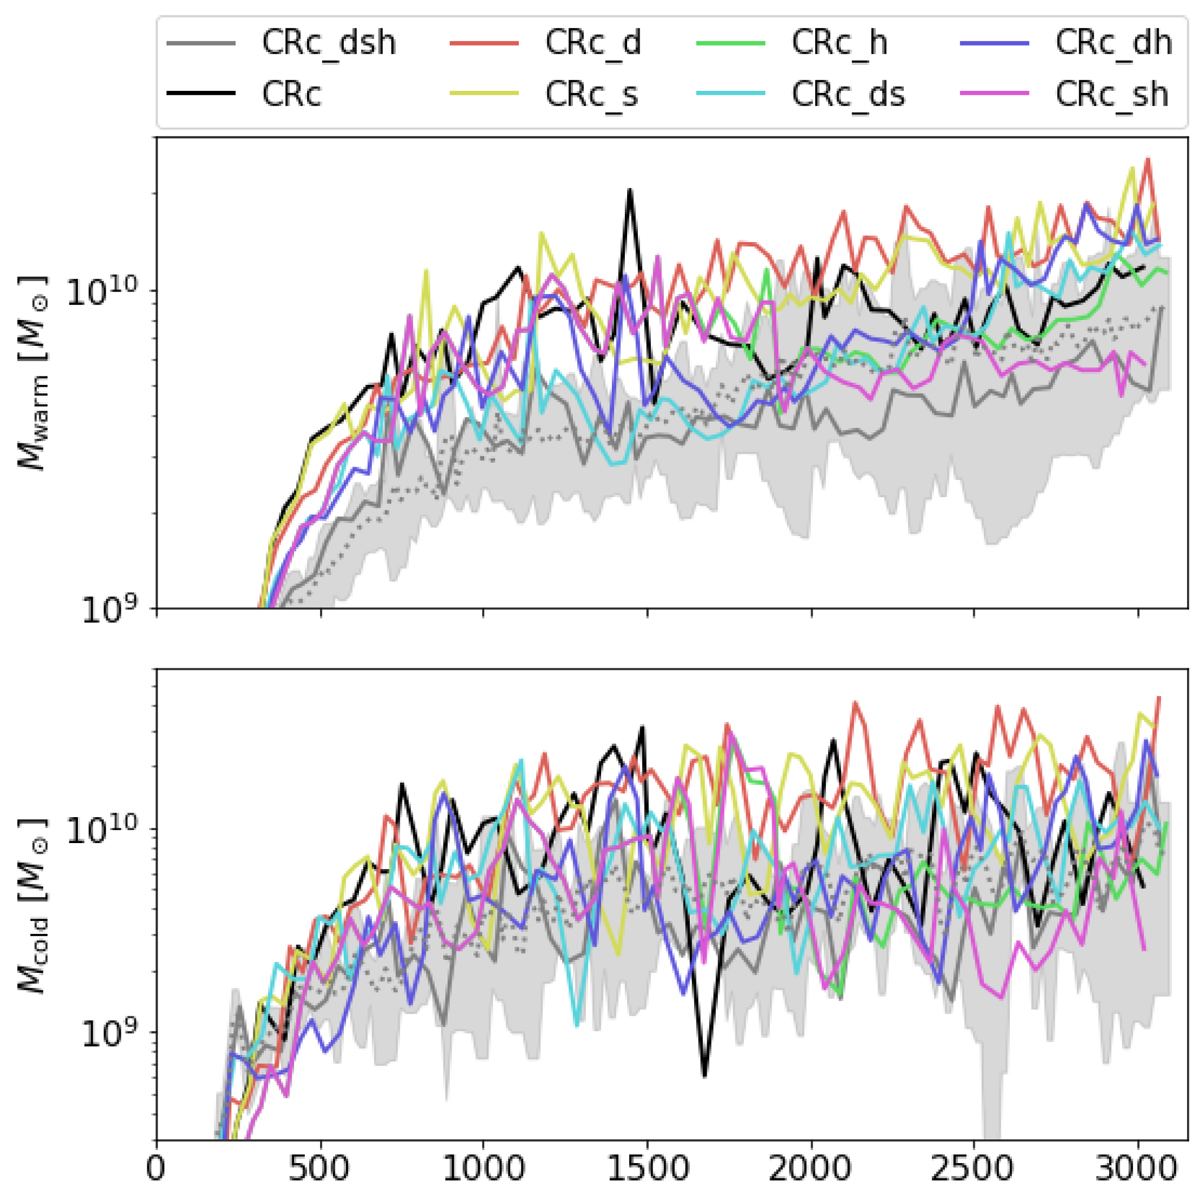
Fig. 9.

Download original image
Time series for the total warm (104 K < T < 106 K) and cold (T < 104 K) gas mass for different CR transport mechanisms in comparison to the range covered by all full-physics simulations based on CRc_dsh presented in Appendix B (grey area). The dotted grey line denotes the mean of the grey area at each point in time. Overall trends are difficult to differentiate when individual simulations are compared due to the chaotic nature of cooling flows.
Current usage metrics show cumulative count of Article Views (full-text article views including HTML views, PDF and ePub downloads, according to the available data) and Abstracts Views on Vision4Press platform.
Data correspond to usage on the plateform after 2015. The current usage metrics is available 48-96 hours after online publication and is updated daily on week days.
Initial download of the metrics may take a while.


