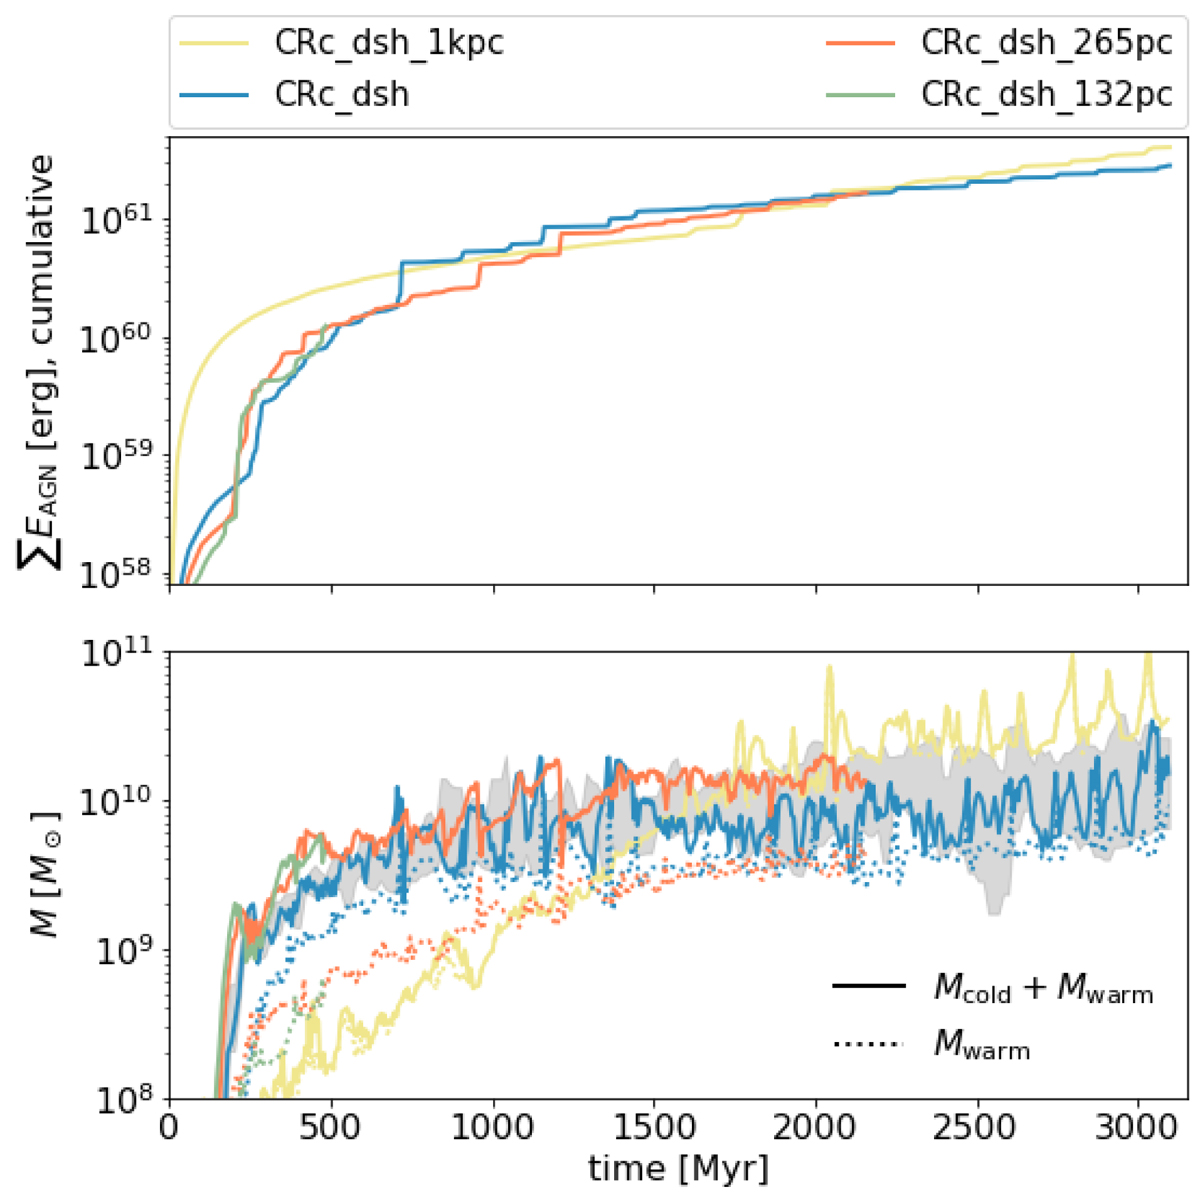
Fig. D.1.

Download original image
Time evolution of the cumulative energy injected by the AGN (top) and the warm and cold (solid bottom) and warm gas only (dotted bottom) gas mass over time. Grey shaded areas show the statistical variation of CRc_dsh from Appendix B. The case with the lowest resolution, CRc_dsh_1kpc, requires significantly more energy to balance cooling flows at both early and late times, and produces predominantly warm gas. All three runs with higher resolution show good convergence in the cumulative AGN energy and total cold and warm gas. A higher resolution leads to more cold gas vs warm gas early on.
Current usage metrics show cumulative count of Article Views (full-text article views including HTML views, PDF and ePub downloads, according to the available data) and Abstracts Views on Vision4Press platform.
Data correspond to usage on the plateform after 2015. The current usage metrics is available 48-96 hours after online publication and is updated daily on week days.
Initial download of the metrics may take a while.


