Fig. 18.

Download original image
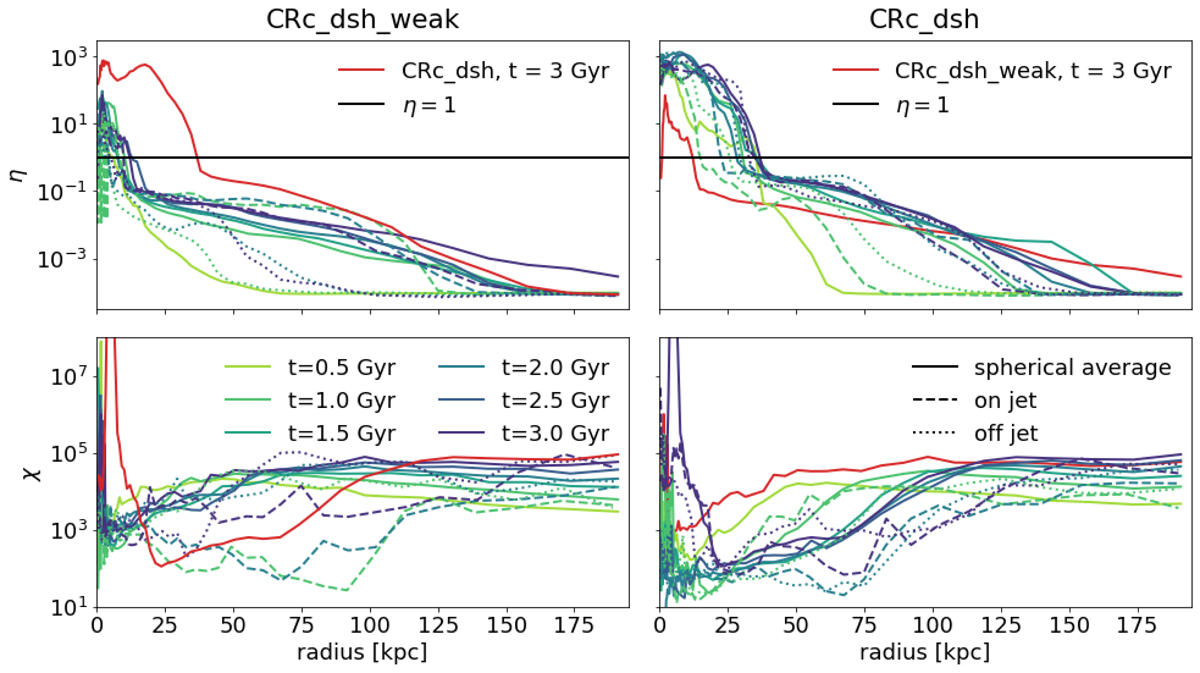
Time evolution of η (top) and χ (bottom) profiles for CRc_dsh_weak (left) and CRc_dsh (right). Solid profiles are a volume-weighted average over the whole sphere. At t = 1.5 and 3 Gyr, we also show the profile measured along the jet (dashed) and along a cylinder perpendicular to the jet (dotted) for comparison. For comparison, the t = 3 Gyr value of the radial averaged profile for the other simulation is shown in red in each plot. In the CR-dominated and kinetic-dominated jets, the cluster core is dominated by CR pressure, but the extent of the CR-dominated core is much larger for a CR-dominated jet.
Current usage metrics show cumulative count of Article Views (full-text article views including HTML views, PDF and ePub downloads, according to the available data) and Abstracts Views on Vision4Press platform.
Data correspond to usage on the plateform after 2015. The current usage metrics is available 48-96 hours after online publication and is updated daily on week days.
Initial download of the metrics may take a while.


