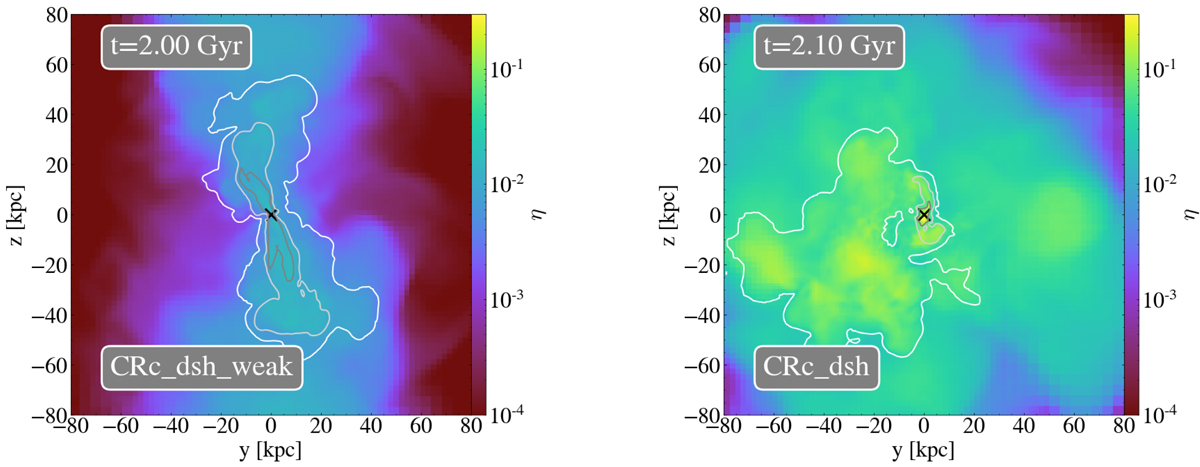
Fig. 11.

Download original image
Temperature-weighted projections of η = Pcr/Ptherm for CRc_dsh_weak (left panel) and CRc_dsh (right panel). Contours show the outline of remnants created by AGN jet ejections that occurred 200 Myr (white), 100 Myr (light grey), and 50 Myr (dark grey) before the snapshot. The black cross shows the current position of the AGN. The CR-dominated jet leads to an isotropic distribution of CRs in the cluster centre through the weak kinetic energy of the jet and the dense central nebula (right). For smaller fractions of CRs, the CRs remain confined to the jet cone (left).
Current usage metrics show cumulative count of Article Views (full-text article views including HTML views, PDF and ePub downloads, according to the available data) and Abstracts Views on Vision4Press platform.
Data correspond to usage on the plateform after 2015. The current usage metrics is available 48-96 hours after online publication and is updated daily on week days.
Initial download of the metrics may take a while.


