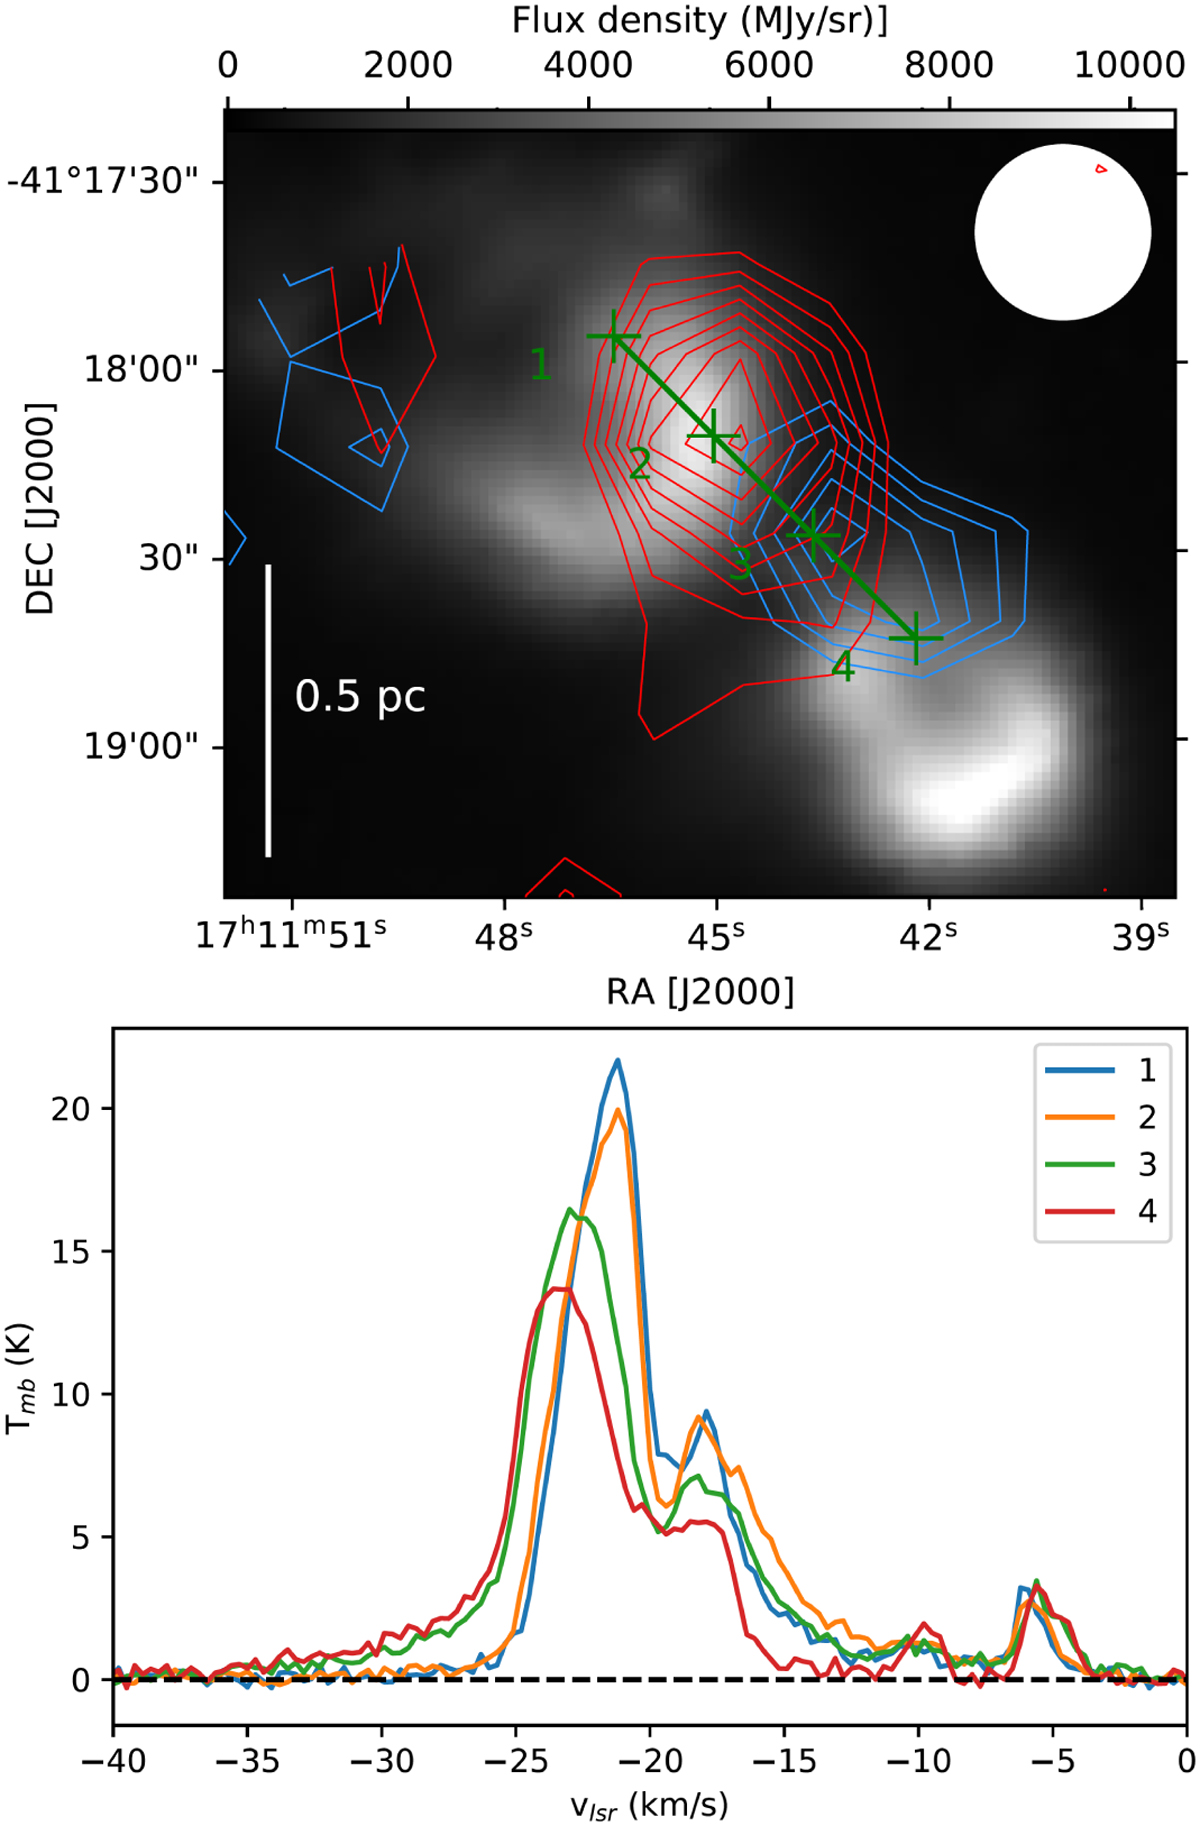
Fig. 7
Download original image
Top: integrated intensity contours of the redshifted (in red) and blueshifted (in blue) 12CO(2–1) high-velocity wings overlaid on the 70 μm map. The contours start at 10 K km s−1 with increment of 2 K kms−1. The green line and crosses indicate the locations of a spectra presented in the bottom panel with position 3 closely coinciding with the location of the H1 fragment. The white circle at the top indicates the beam size of the 12CO(2–1) data. Bottom: 12CO(2–1) spectra at the indicated locations in the top panel.
Current usage metrics show cumulative count of Article Views (full-text article views including HTML views, PDF and ePub downloads, according to the available data) and Abstracts Views on Vision4Press platform.
Data correspond to usage on the plateform after 2015. The current usage metrics is available 48-96 hours after online publication and is updated daily on week days.
Initial download of the metrics may take a while.