Fig. 4
Download original image
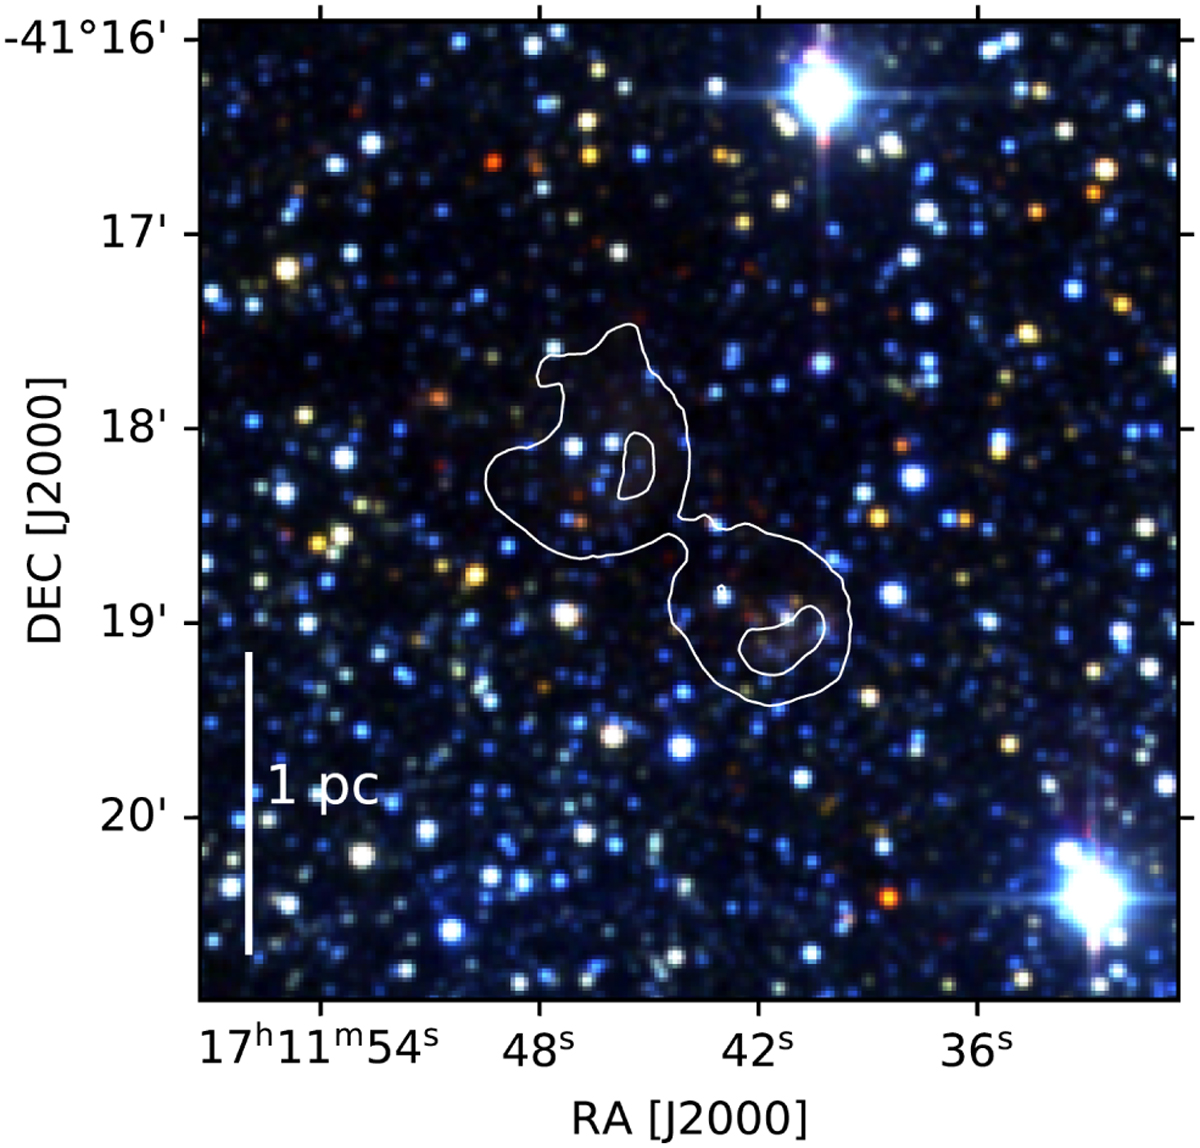
RGB image of the 2MASS J-band (in blue), H-band (in green) and K-band (in red). The white contours indicate the 70 μm continuum emission at 2000 and 8000 MJy sr−1, to highlight the location of the full 70 μm nebulosities and the brightest regions of the 70 μm nebulosities, respectively. The 2MASS data shows no evident stellar overdensity in the cavities which would point to the presence of clusters.
Current usage metrics show cumulative count of Article Views (full-text article views including HTML views, PDF and ePub downloads, according to the available data) and Abstracts Views on Vision4Press platform.
Data correspond to usage on the plateform after 2015. The current usage metrics is available 48-96 hours after online publication and is updated daily on week days.
Initial download of the metrics may take a while.