Fig. 3
Download original image
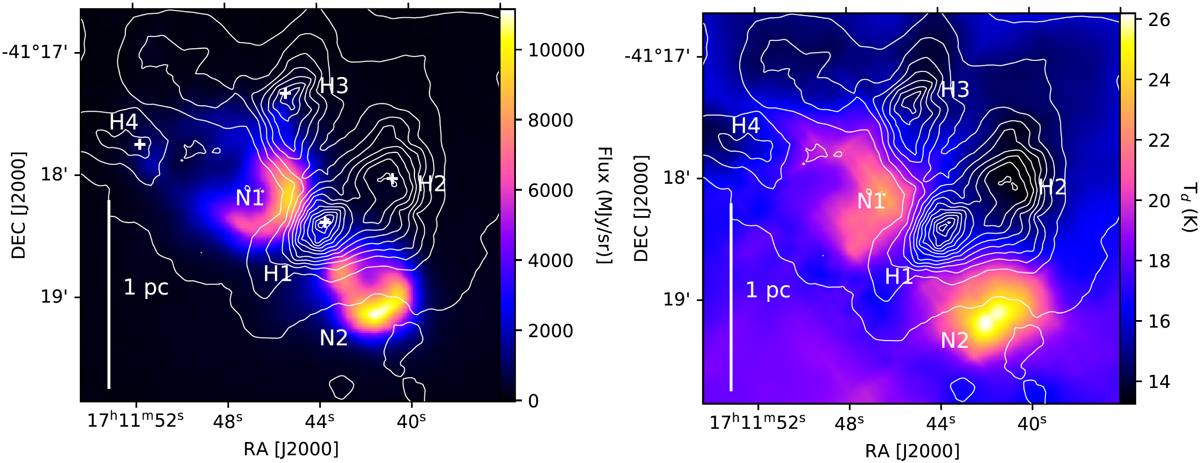
Left: Berschel 70 μm image of the central region/hub of G345.88-1.10, showing the presence of a bipolar nebulosity N1 and N2. The H2 column density contours are overplotted in white starting at ![]() cm−2 with increments of 2 × 1022 cm−2. The 4 fragments that were extracted from the column density map with the dendrogram technique are indicated by the white crosses together with the two nebulosities. Right: image of the Berschel dust temperature centred on the infrared nebulosity. All symbols and notations are identical to those presented in the left-hand-side panel.
cm−2 with increments of 2 × 1022 cm−2. The 4 fragments that were extracted from the column density map with the dendrogram technique are indicated by the white crosses together with the two nebulosities. Right: image of the Berschel dust temperature centred on the infrared nebulosity. All symbols and notations are identical to those presented in the left-hand-side panel.
Current usage metrics show cumulative count of Article Views (full-text article views including HTML views, PDF and ePub downloads, according to the available data) and Abstracts Views on Vision4Press platform.
Data correspond to usage on the plateform after 2015. The current usage metrics is available 48-96 hours after online publication and is updated daily on week days.
Initial download of the metrics may take a while.