Fig. C.1
Download original image
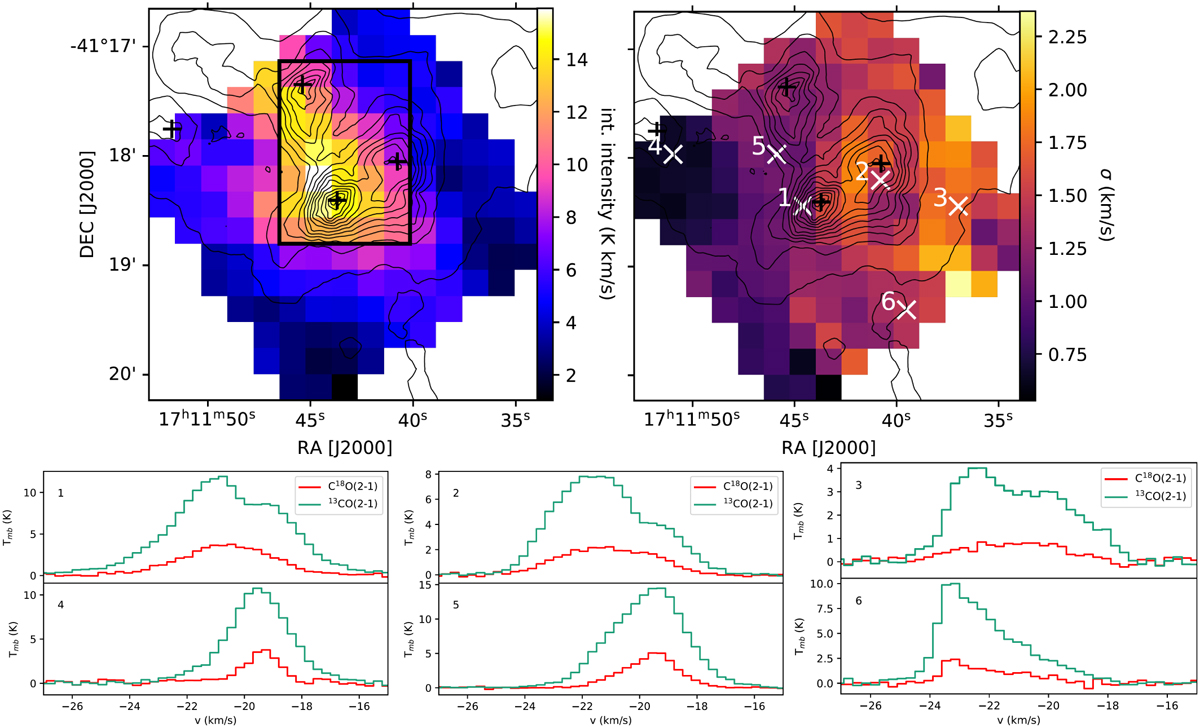
(left) C18O(2–1) integrated intensity map from -30 km s−1 to −10 km s−1. Overplotted in black are the Herschel column density contours starting at ![]() cm−2 with increments of 2×1022 cm−2. The black crosses indicate the 4 extracted fragments from the column density map and the black rectangle indicates the region used to extract the spectra presented in Fig. 2. (right) The velocity dispersion map from fitting the Gaussian to the C18O(2–1) spectra, with overplotted in black the Herschel column density contours. The white crosses indicate the locations of the spectra presented below. (bottom) The 13CO(2–1) and C18O(2–1) spectra at the locations in the hub indicated in the velocity dispersion map. The spectra at the location of the cavities (spectra 5 & 6) show skewed spectra in both 13CO(2–1) and C18O(2–1).
cm−2 with increments of 2×1022 cm−2. The black crosses indicate the 4 extracted fragments from the column density map and the black rectangle indicates the region used to extract the spectra presented in Fig. 2. (right) The velocity dispersion map from fitting the Gaussian to the C18O(2–1) spectra, with overplotted in black the Herschel column density contours. The white crosses indicate the locations of the spectra presented below. (bottom) The 13CO(2–1) and C18O(2–1) spectra at the locations in the hub indicated in the velocity dispersion map. The spectra at the location of the cavities (spectra 5 & 6) show skewed spectra in both 13CO(2–1) and C18O(2–1).
Current usage metrics show cumulative count of Article Views (full-text article views including HTML views, PDF and ePub downloads, according to the available data) and Abstracts Views on Vision4Press platform.
Data correspond to usage on the plateform after 2015. The current usage metrics is available 48-96 hours after online publication and is updated daily on week days.
Initial download of the metrics may take a while.