Open Access
Fig. B.1
Download original image
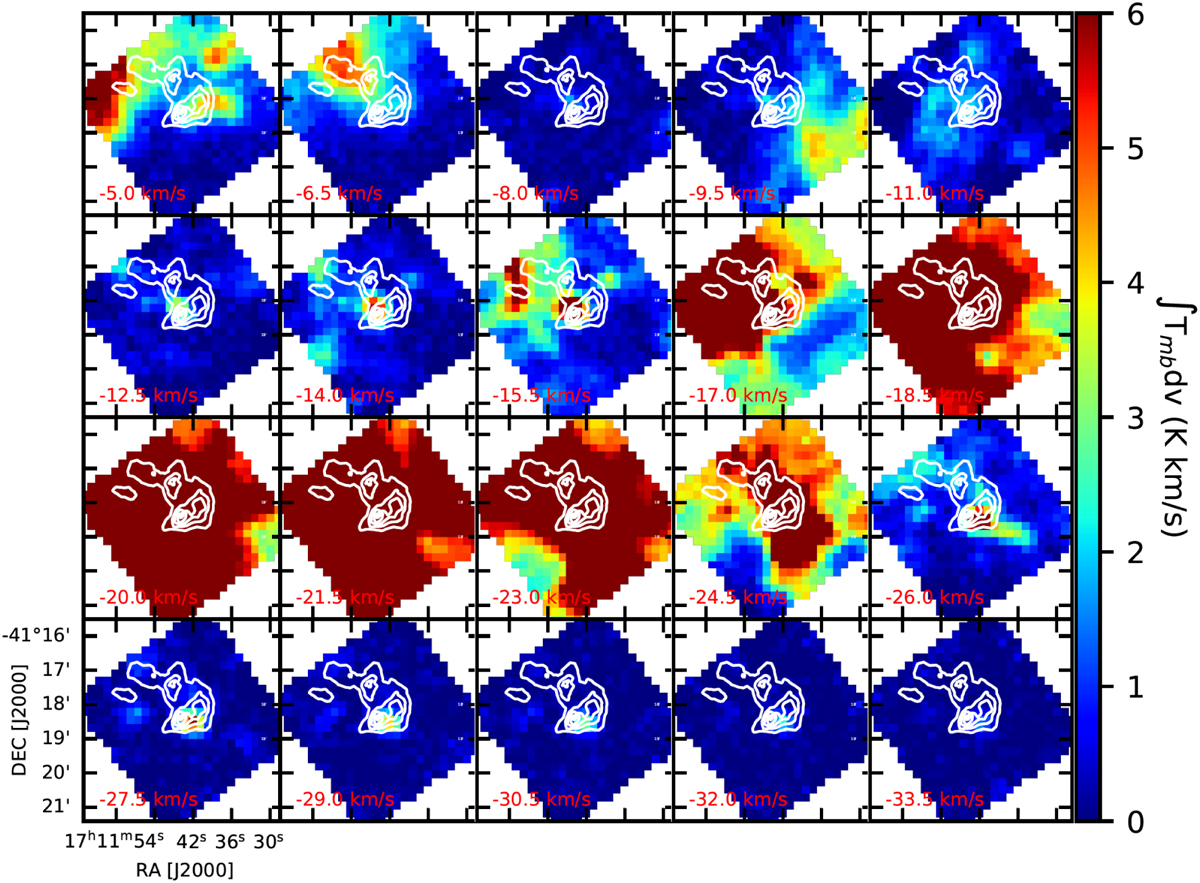
12CO(2–1) channel maps over the full velocity range of the spectra with white Herschel column density contours highlighting the G345.88-1.10 hub. The colourbar was chosen to highlight the emission associated with the 12CO(2–1) wings, which explain why the figure is saturated in the figure between −25 km s−1 and −15 km s−1.
Current usage metrics show cumulative count of Article Views (full-text article views including HTML views, PDF and ePub downloads, according to the available data) and Abstracts Views on Vision4Press platform.
Data correspond to usage on the plateform after 2015. The current usage metrics is available 48-96 hours after online publication and is updated daily on week days.
Initial download of the metrics may take a while.