Fig. 14
Download original image
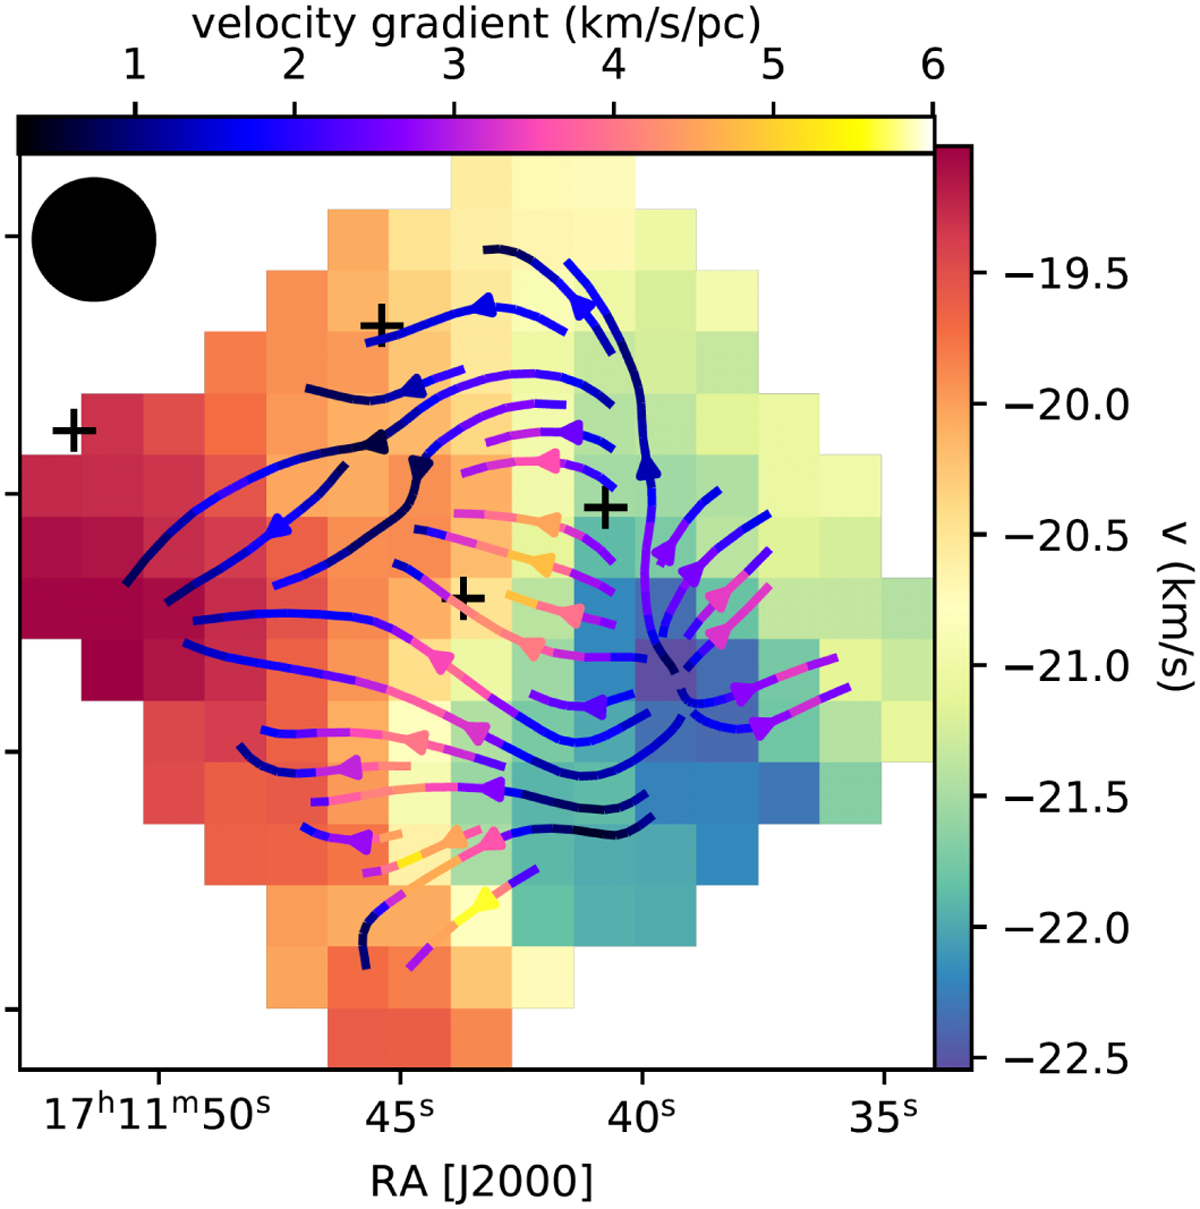
Velocity centroid map obtained by fitting a Gaussian profile to the C18O(2–1) spectra. The calculated velocity gradient is overplotted on top of it, using streamplot (https://matplotlib.org/stable/api_as_gen/matplotlib.pyplot.streamplot.html), showing organised motion. The colourbar of this streamplot, located on top of the figure, indicates the magnitude of the velocity gradient at each location. The black circle indicates the beam size of the presented APEX observations and the black crosses indicate the position of the 4 massive fragments.
Current usage metrics show cumulative count of Article Views (full-text article views including HTML views, PDF and ePub downloads, according to the available data) and Abstracts Views on Vision4Press platform.
Data correspond to usage on the plateform after 2015. The current usage metrics is available 48-96 hours after online publication and is updated daily on week days.
Initial download of the metrics may take a while.