Fig. 1
Download original image
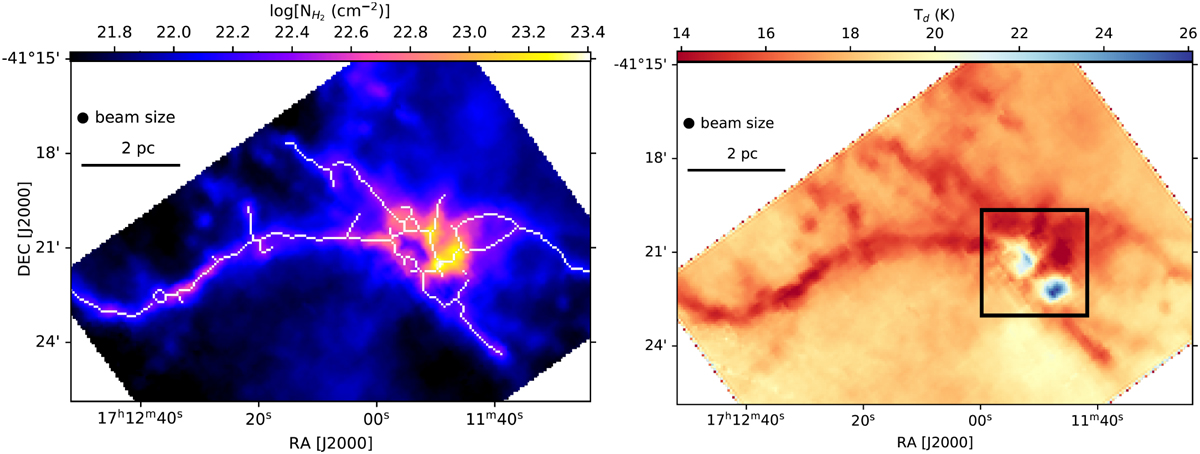
Left: H2 column density image of G345.88-1.10 on a log scale at a spatial resolution of 18″ derived from Herschel data at 160 and 250 μm. The hub morphology has been highlighted by the skeleton of the filament network present in the region. Right: corresponding Herschel dust temperature map. The black box indicates the region of interest for this paper which is presented in more detail in Fig. 3.
Current usage metrics show cumulative count of Article Views (full-text article views including HTML views, PDF and ePub downloads, according to the available data) and Abstracts Views on Vision4Press platform.
Data correspond to usage on the plateform after 2015. The current usage metrics is available 48-96 hours after online publication and is updated daily on week days.
Initial download of the metrics may take a while.