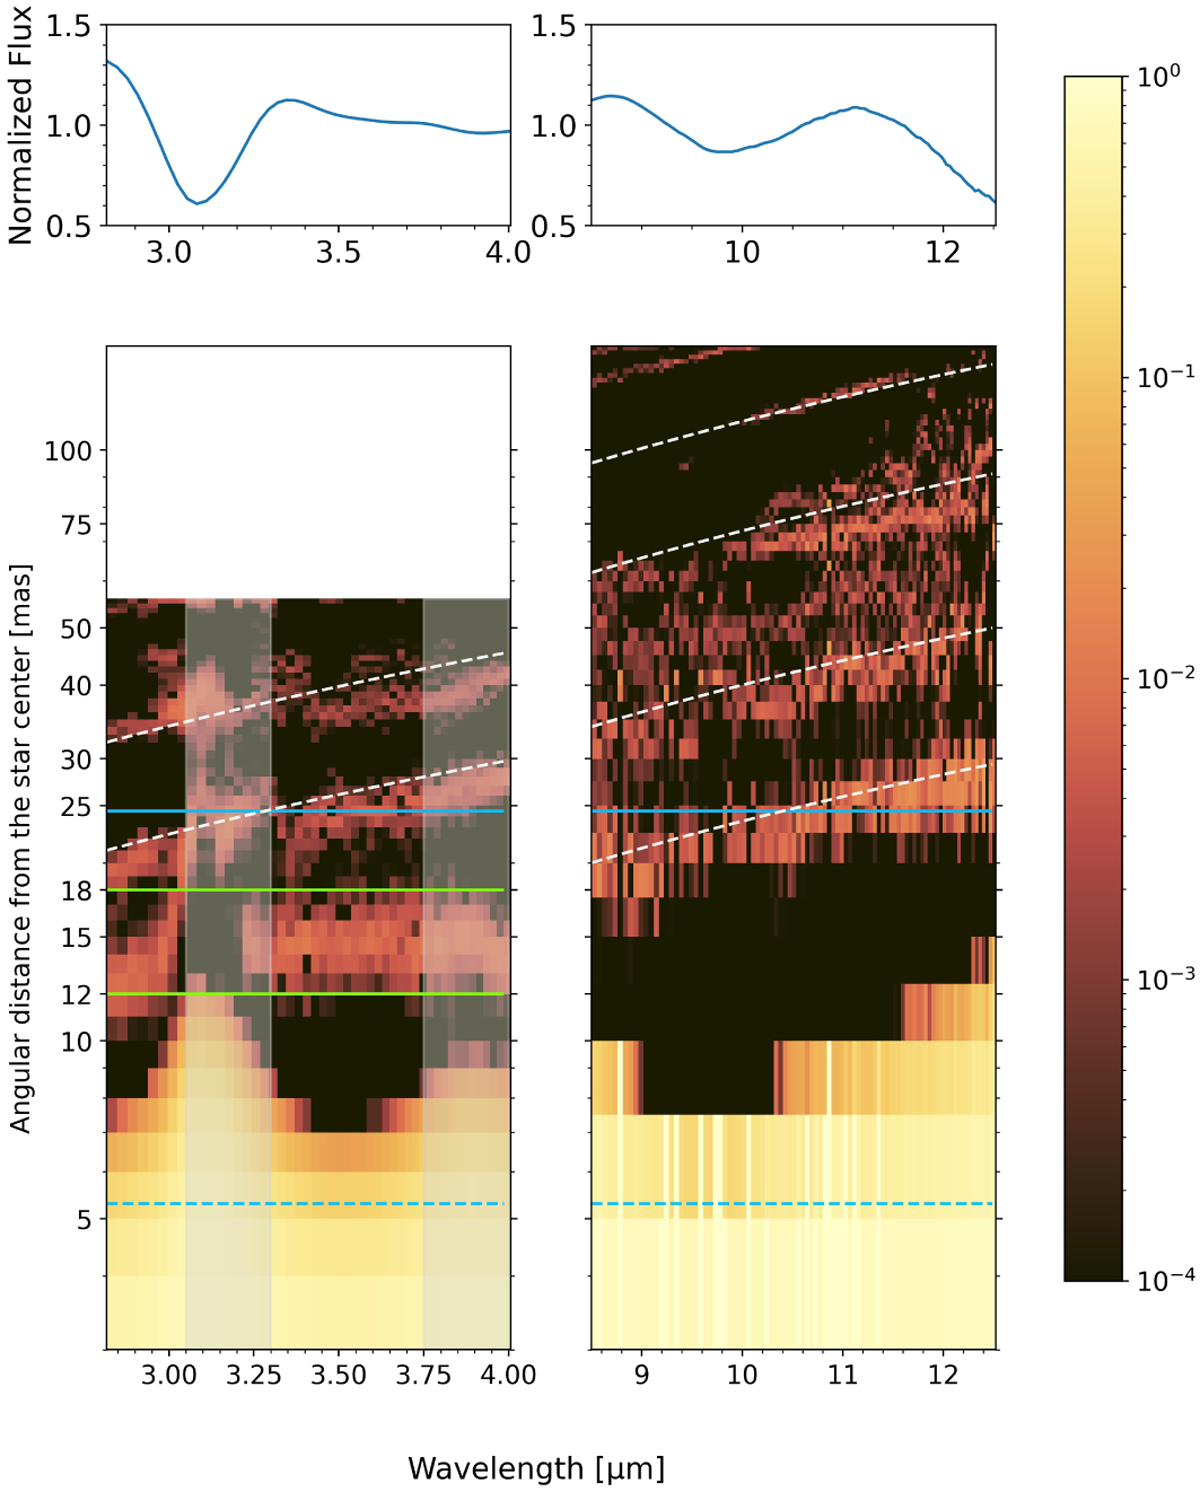
Fig. 4
Download original image
Spectra of the intensity profiles in L- and N-bands. Upper panels: observed MATISSE spectrum normalized by the median and then divided by a black body spectra at T = 2700 K to underline the observed emission and absorption features. Lower panels: spectro-radial maps in L- and N-band obtained by plotting the best intensity Hankel profile normalized at one for each observed wavelength. The faint red structures highlighted with the inclined dashed-white lines are reconstruction artifacts (see Sect. 4.2 for details). The dashed and solid blue horizontal lines show the position of the Rosseland radius and the DUSTY inner radius respectively. The solid green horizontal lines delimit the extension of a hot distinct molecular layer (see Sect. 5.3). The grey vertical bands cover the spectral ranges where the centro-symmetric Hankel profile is not able to properly reproduce the asymmetric shape of R Scl revealed by non-zero closure phases.
Current usage metrics show cumulative count of Article Views (full-text article views including HTML views, PDF and ePub downloads, according to the available data) and Abstracts Views on Vision4Press platform.
Data correspond to usage on the plateform after 2015. The current usage metrics is available 48-96 hours after online publication and is updated daily on week days.
Initial download of the metrics may take a while.