Fig. 3
Download original image
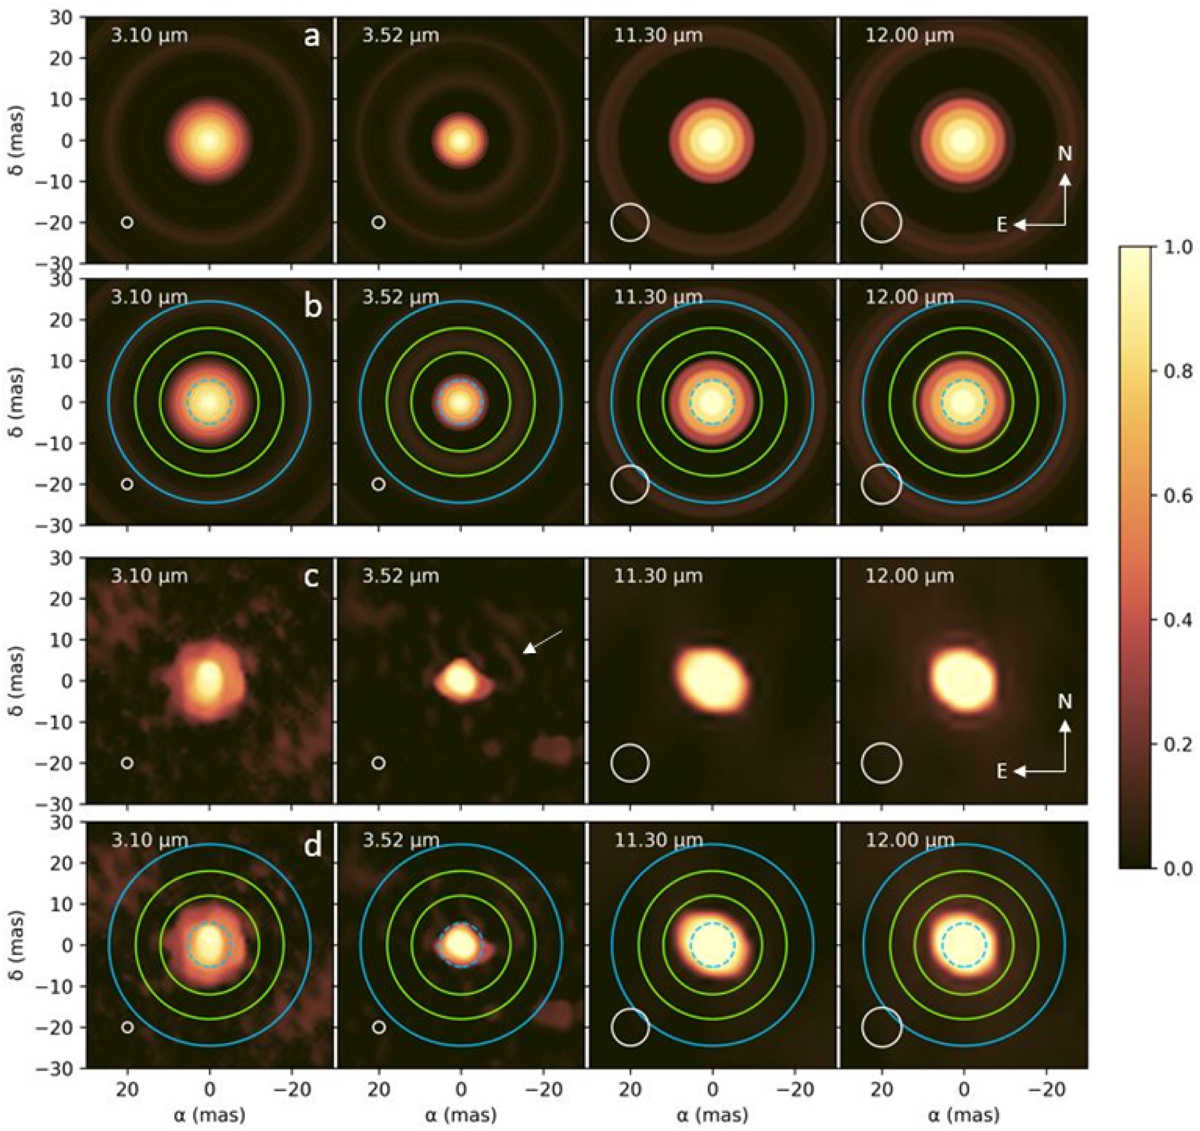
Reconstructed Hankel distribution from radial profiles (row a), the same with the identified features highlighted (row b), images reconstructed with MIRA (row c), and the same with features highlighted (row d). Each panel shows the reconstructed image at the wavelength shown at its left top corner, covering the L-band (3–4 µm) and the N-band (8–13 µm). In these panels, the blue dashed circle in the center shows the calculated Rosseland radius of the stellar photosphere, the green circles represent the inner and outer boundary of the distinct molecular shell (seen here only at 3.52 µm and only clearly identifiable in the Hankel reconstruction), the blue circle represents the inner boundary of the dust envelope predicted by DUSTY, while the white circle at each bottom left corner shows the theoretical angular resolution of the interferometer. The white arrow shows the north-west arc structure referenced in Sect. 4.3.3.
Current usage metrics show cumulative count of Article Views (full-text article views including HTML views, PDF and ePub downloads, according to the available data) and Abstracts Views on Vision4Press platform.
Data correspond to usage on the plateform after 2015. The current usage metrics is available 48-96 hours after online publication and is updated daily on week days.
Initial download of the metrics may take a while.