Fig. 1
Download original image
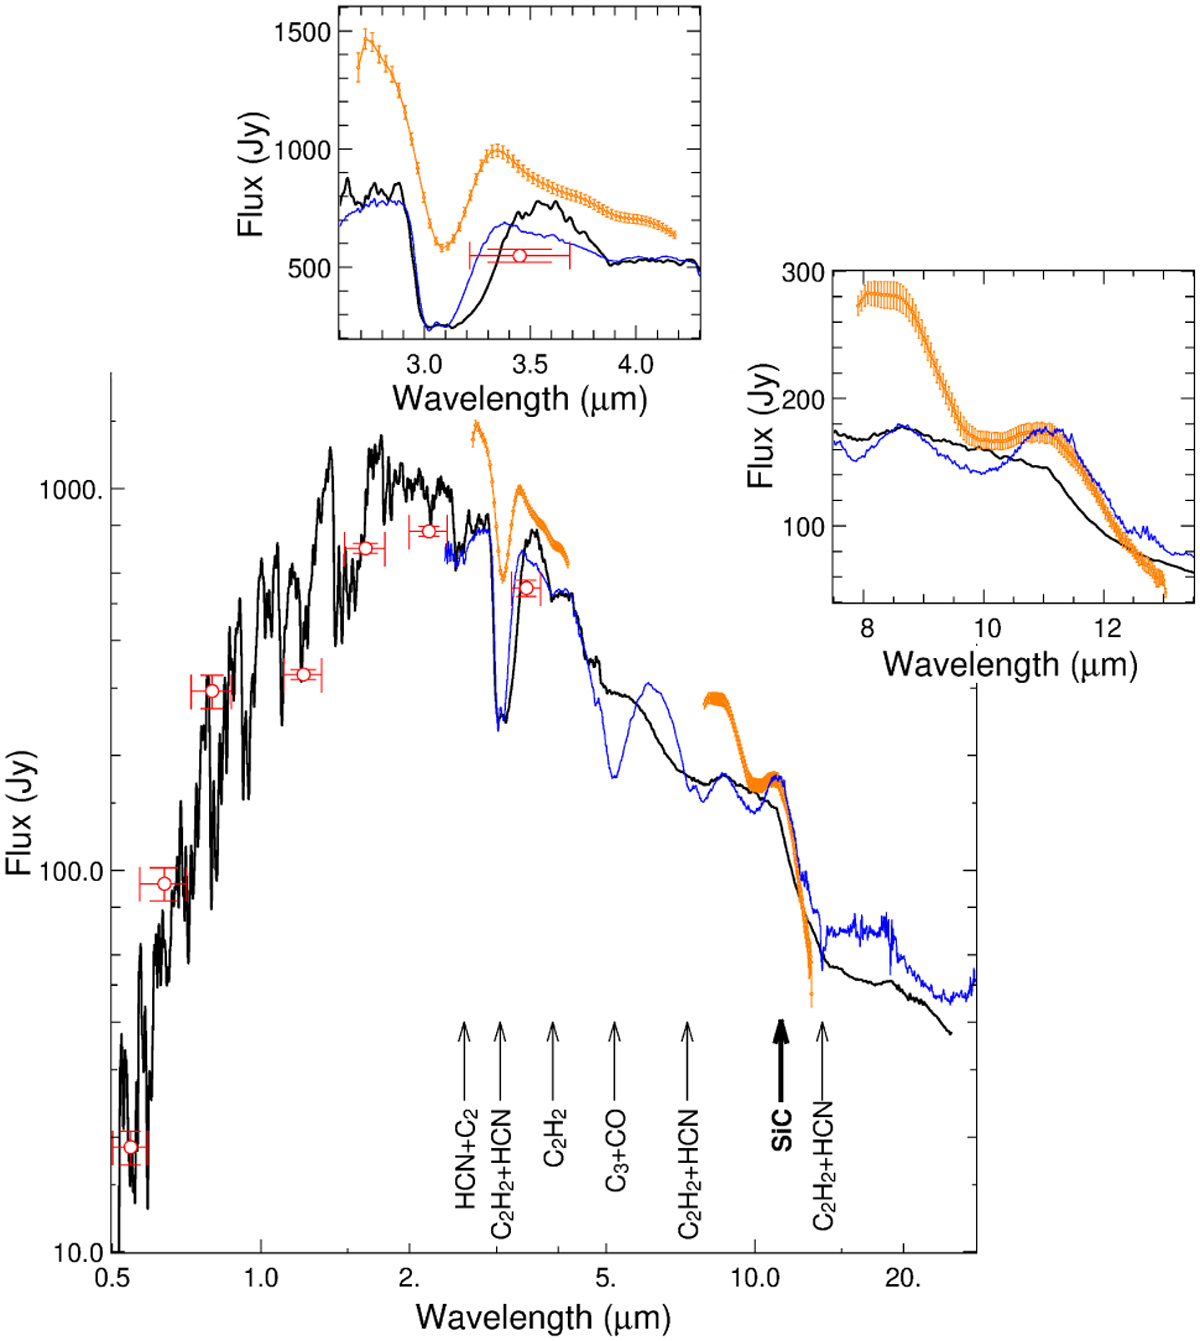
SED of R Scl (log-log scales). Orange spectra: MATISSE data-sets in L- and N-bands with their associated error bars. Blue spectra: the ISO/SWS spectrum. Red points: photo metric fata from the literature. The solid black line is the best COMARCS+DUSTY model (see Sect. 3). Spectral features are labeled with arrows. ansets zoom onto the MATISSE spectrum (linear scales). SiC is marked as boldface as it is solid state, unlike the other gaseous species.
Current usage metrics show cumulative count of Article Views (full-text article views including HTML views, PDF and ePub downloads, according to the available data) and Abstracts Views on Vision4Press platform.
Data correspond to usage on the plateform after 2015. The current usage metrics is available 48-96 hours after online publication and is updated daily on week days.
Initial download of the metrics may take a while.