Fig. A.1.
Download original image
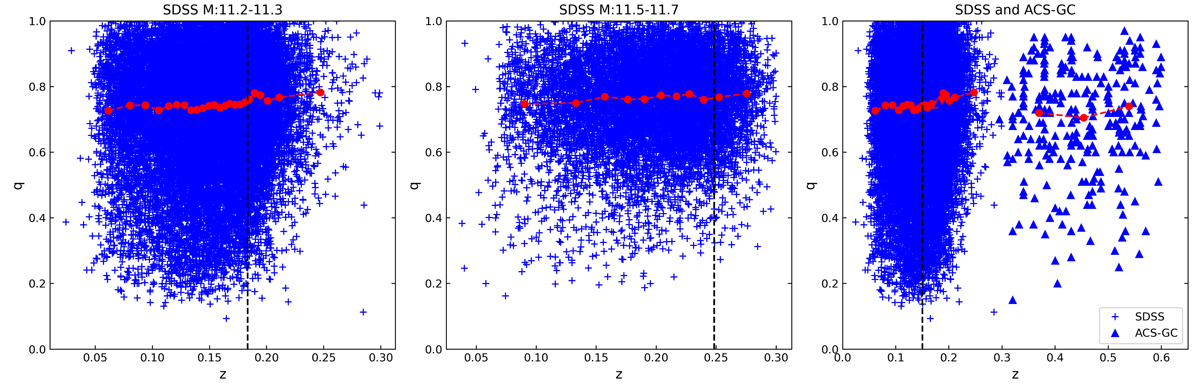
Axis ratios of galaxies as a function of redshifts in different samples. Left: Axis ratio of passive galaxies with M⋆ = 1011.2 − 1011.3 M⊙ from the SDSS as a function of redshift. The red dots are the median for every 1000 sources. The black dash line denotes the mass-complete redshift. Middle: Axis ratio of passive galaxies with M⋆ = 1011.5 − 1011.7 M⊙ from the SDSS. Right: Axis ratio of the passive galaxies from the SDSS and the ACS-GC. The galaxies from SDSS are with M⋆ = 1011.2 − 1011.3 M⊙ and marked with blue crosses, while the galaxies from the ACS-GC are with M⋆ = 1011 − 1011.5 M⊙ and marked with blue triangles. The median q of sources from the ACS-GC are calculated for every 100 sources.
Current usage metrics show cumulative count of Article Views (full-text article views including HTML views, PDF and ePub downloads, according to the available data) and Abstracts Views on Vision4Press platform.
Data correspond to usage on the plateform after 2015. The current usage metrics is available 48-96 hours after online publication and is updated daily on week days.
Initial download of the metrics may take a while.