Fig. 5.
Download original image
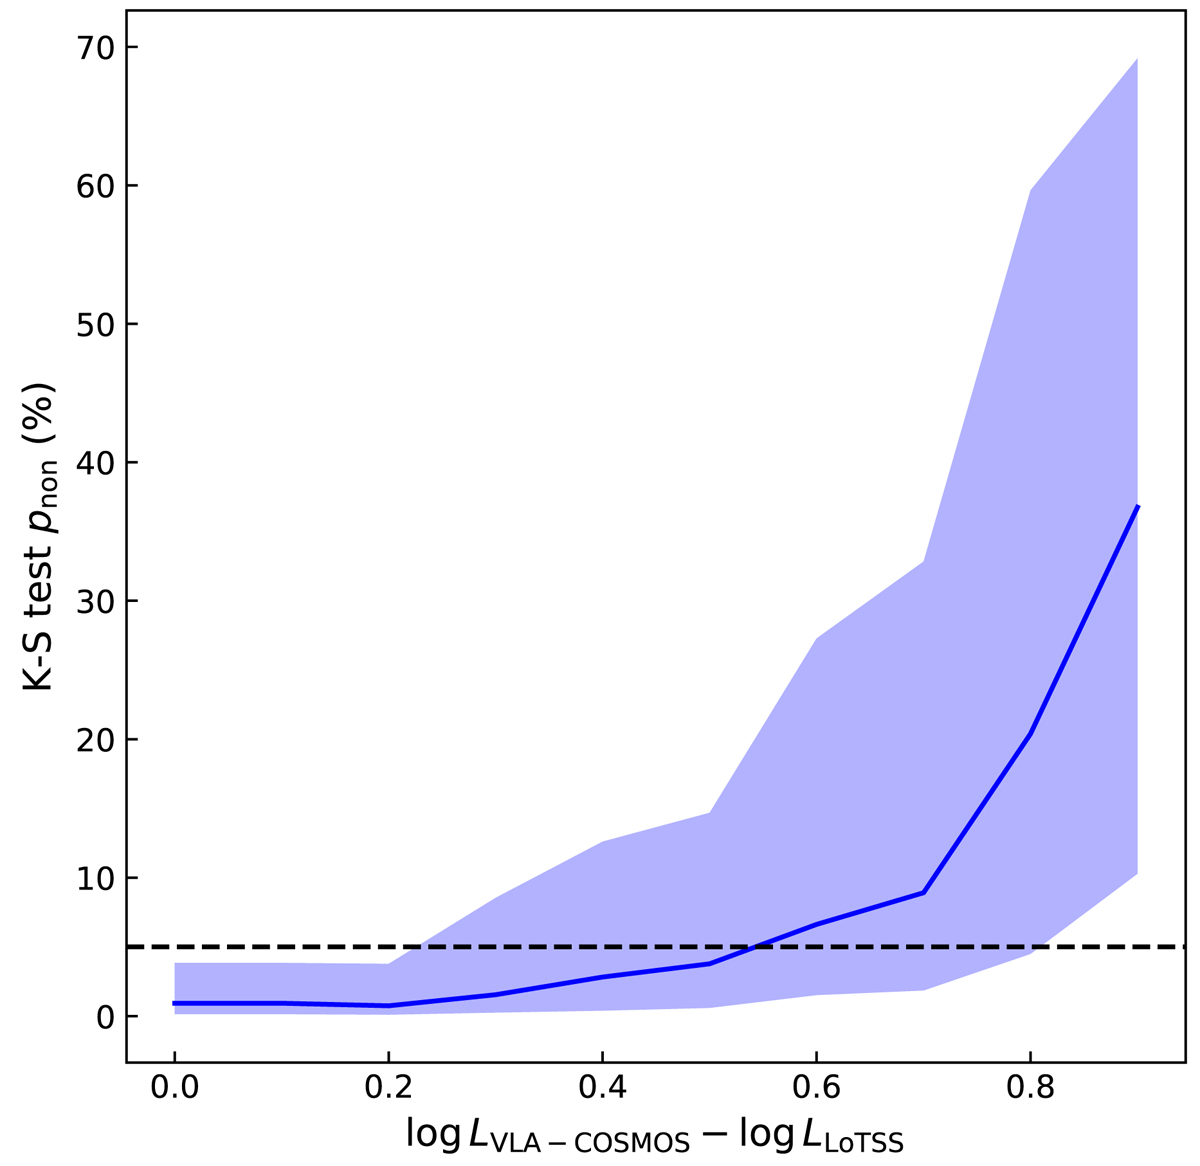
Null hypothesis probability as a function of luminosity difference between high-redshift and low-redshift RLAGNs at fixed stellar mass. The blue line denotes the median p-value from 1000 simulations at different Δlog L150 MHz, while the shaded area represents the 1σ deviations. The black dashed line represents the 5% threshold below which the null hypothesis is rejected.
Current usage metrics show cumulative count of Article Views (full-text article views including HTML views, PDF and ePub downloads, according to the available data) and Abstracts Views on Vision4Press platform.
Data correspond to usage on the plateform after 2015. The current usage metrics is available 48-96 hours after online publication and is updated daily on week days.
Initial download of the metrics may take a while.