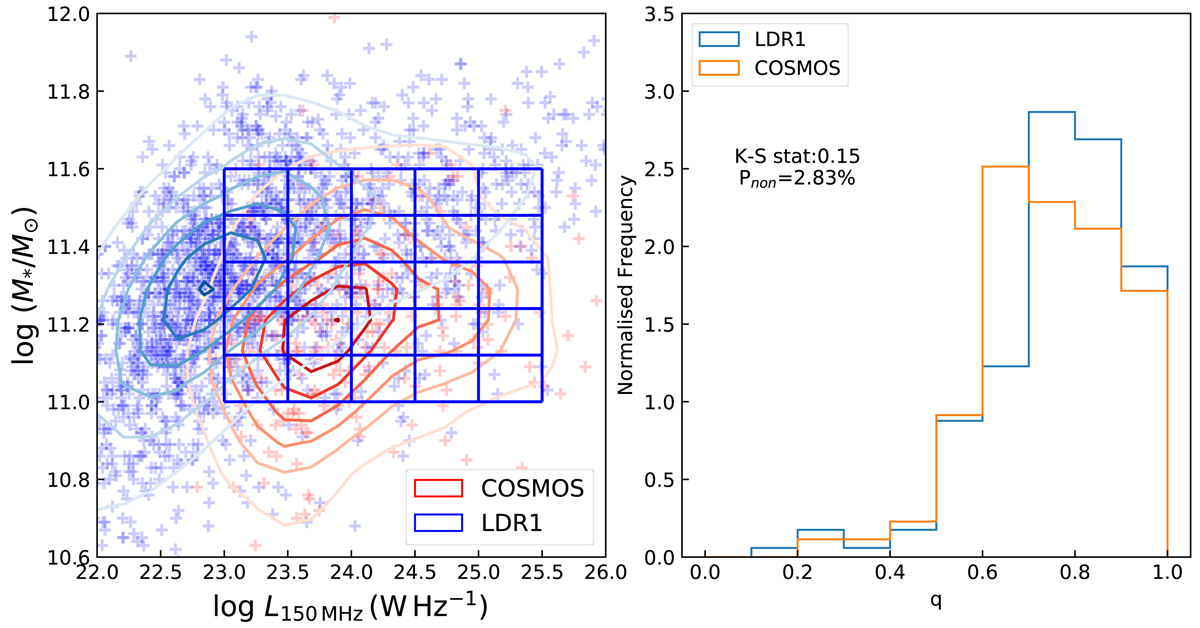
Fig. 4.
Download original image
Left: stellar mass and 150 MHz radio luminosity of RLAGNs in this work and in Z20. The red crosses and contours represent RLAGNs in the COSMOS field used in this work, while the blue crosses and contours represent RLAGNs from the LoTSS DR1 used in Z20. The blue rectangle marks the sampling region and the bins used to construct the control sample. Right: projected axis ratio distributions of RLAGNs in this work and in the low-redshift control sample based on RLAGNs in the LoTSS DR1. The orange histogram denotes the normalised frequency distribution of RLAGNs in this work, while the blue histogram denotes the distribution of RLAGNs in the low-redshift control sample. The K–S result listed here is based on the median of 1000 tests.
Current usage metrics show cumulative count of Article Views (full-text article views including HTML views, PDF and ePub downloads, according to the available data) and Abstracts Views on Vision4Press platform.
Data correspond to usage on the plateform after 2015. The current usage metrics is available 48-96 hours after online publication and is updated daily on week days.
Initial download of the metrics may take a while.