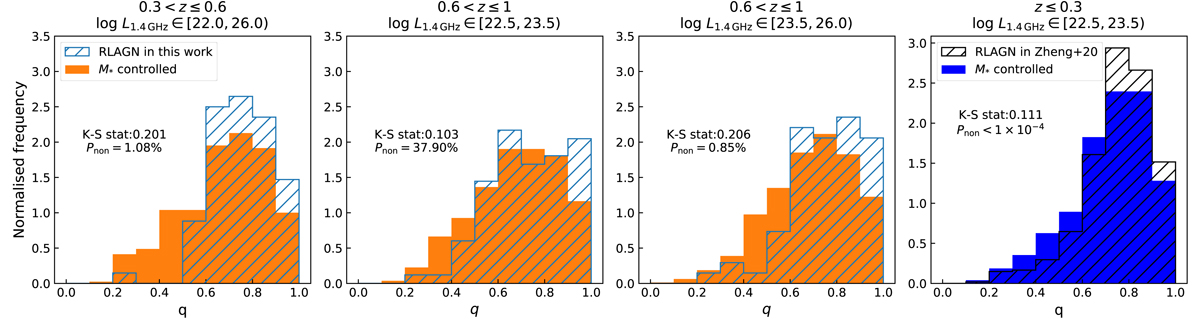
Fig. 3.
Download original image
Projected axis ratio distributions of RLAGNs and the non-RLAGN control sample. The first three panels show the distribution for sources within redshift 0.3–1 selected in this work. The last panel, for comparison, shows sources with redshift of less than 0.3 based on Z20. The filled histograms represent the normalised frequency distributions for non-RLAGN galaxies, while the over-plotted blue hatched histograms represent the hosts of RLAGNs. The radio luminosity and redshift range of the RLAGN samples are noted at the top of the panels. The p-values derived from the median of 100 K–S tests are listed in the panels.
Current usage metrics show cumulative count of Article Views (full-text article views including HTML views, PDF and ePub downloads, according to the available data) and Abstracts Views on Vision4Press platform.
Data correspond to usage on the plateform after 2015. The current usage metrics is available 48-96 hours after online publication and is updated daily on week days.
Initial download of the metrics may take a while.