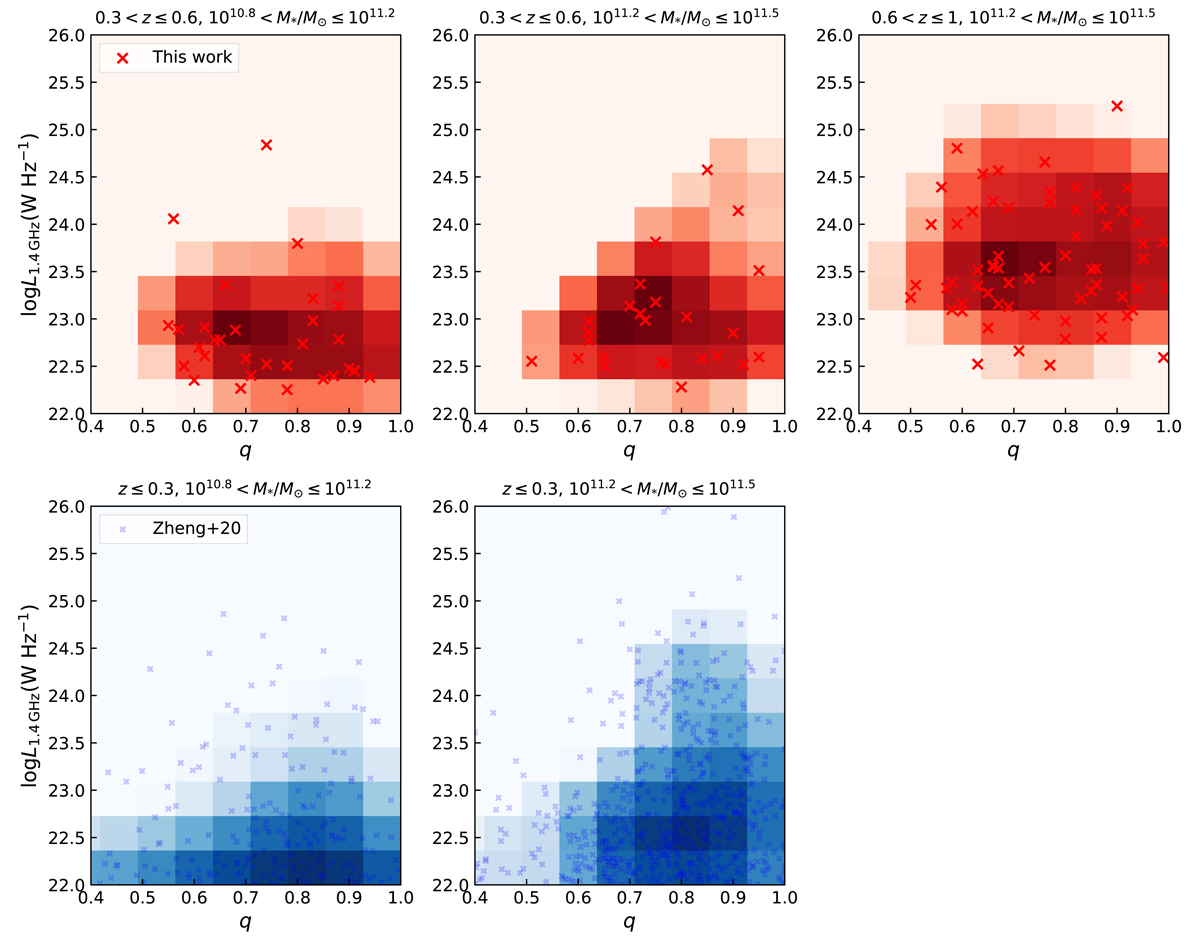
Fig. 2.
Download original image
Distribution of RLAGNs with different redshifts at fixed M⋆ in the L1.4 GHz–q plane. The top three panels show the distributions of RLAGNs selected in this work, while the bottom panels show the distributions of RLAGNs presented by Zheng et al. (2020) and based on LoTSS DR1. The redshift and M⋆ ranges are noted at the top of each panel. Smoothed results based on KDE are shown in the background as 2D histograms.
Current usage metrics show cumulative count of Article Views (full-text article views including HTML views, PDF and ePub downloads, according to the available data) and Abstracts Views on Vision4Press platform.
Data correspond to usage on the plateform after 2015. The current usage metrics is available 48-96 hours after online publication and is updated daily on week days.
Initial download of the metrics may take a while.