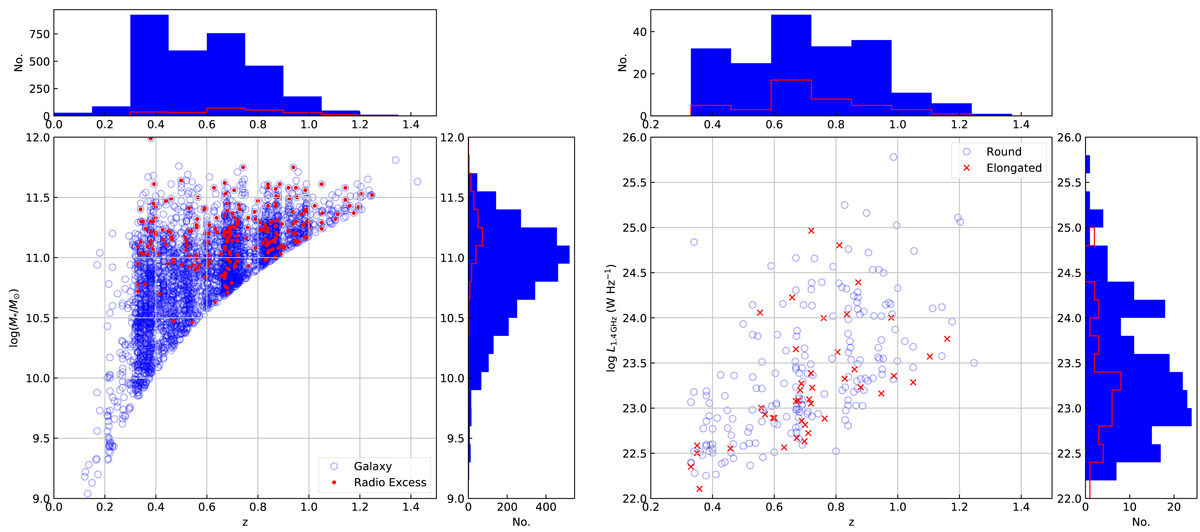
Fig. 1.
Download original image
Left: distribution of M⋆ and redshift of the galaxies in this work. Blue circles and histograms represent passive galaxies and their M⋆ or redshift distributions. Red dots and the red histograms are for the RLAGNs. Right: distribution of rest-frame 1.4 GHz AGN radio luminosity and redshift of the RLAGNs used in this work. Blue circles and histograms represent round (q > 0.6) galaxies and their radio luminosity or redshift distributions, while red crosses and histograms are for the elongated (q ≤ 0.6) galaxies.
Current usage metrics show cumulative count of Article Views (full-text article views including HTML views, PDF and ePub downloads, according to the available data) and Abstracts Views on Vision4Press platform.
Data correspond to usage on the plateform after 2015. The current usage metrics is available 48-96 hours after online publication and is updated daily on week days.
Initial download of the metrics may take a while.