Fig. 4.
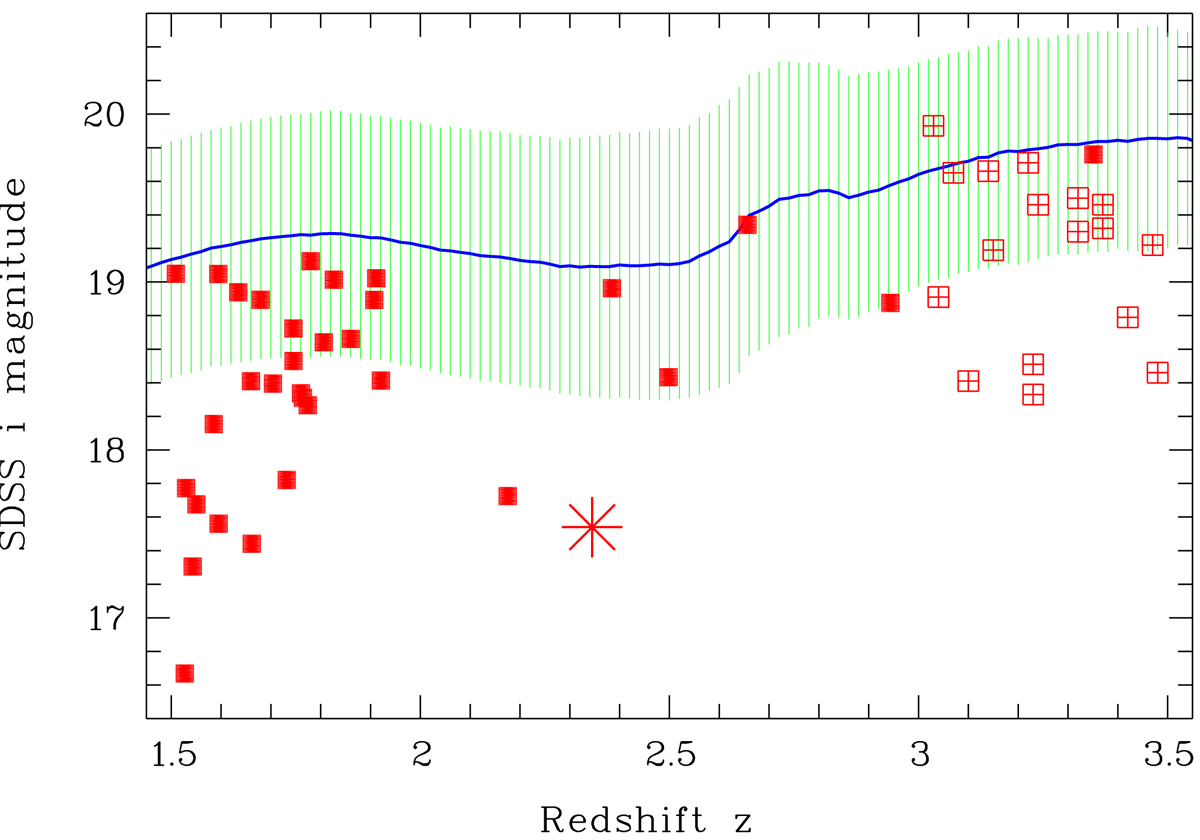
Download original image
Magnitude-redshift diagram of WLQs for 1.5 ≤ z ≤ 3.5. Red symbols: WLQ sample from Diamond-Stanic et al. (2009) (framed crosses); EW-selected sub-sample (EW(C IV) < 4.8 Å) from Meusinger & Balafkan (2014) (squares); and VPMS J1708+4332 (asterisk). For comparison, the distribution of all SDSS DR7 quasars from the Shen et al. (2011) catalogue is marked by the median relation (thick blue curve) and the standard deviation (hatched green area).
Current usage metrics show cumulative count of Article Views (full-text article views including HTML views, PDF and ePub downloads, according to the available data) and Abstracts Views on Vision4Press platform.
Data correspond to usage on the plateform after 2015. The current usage metrics is available 48-96 hours after online publication and is updated daily on week days.
Initial download of the metrics may take a while.